Prompted in part by a presentation I have to give tomorrow as an OU eLearning community session (I hope some folks turn up – the 90 minute session on Mashing Up the PLE – RSS edition is the only reason I’m going in…), and in part by Scott Leslie’s compelling programme for a similar duration Mashing Up your own PLE session (scene scetting here: Hunting the Wily “PLE”), I started having a tinker with using Google spreadsheets as for data table screenscraping.
So here’s a quick summary of (part of) what I found I could do.
The Google spreadsheet function =importHTML(“”,”table”,N) will scrape a table from an HTML web page into a Google spreadsheet. The URL of the target web page, and the target table element both need to be in double quotes. The number N identifies the N’th table in the page (counting starts at 0) as the target table for data scraping.
So for example, have a look at the following Wikipedia page – List of largest United Kingdom settlements by population (found using a search on Wikipedia for uk city population – NOTE: URLs (web addresses) and actual data tables may have changed since this post was written, BUT you should be able to find something similar…):

Grab the URL, fire up a new Google spreadsheet, and satrt to enter the formula “=importHTML” into one of the cells:
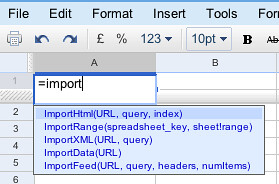
Autocompletion works a treat, so finish off the expression:
=ImportHtml(“http://en.wikipedia.org/wiki/List_of_largest_United_Kingdom_settlements_by_population”,”table”,1)

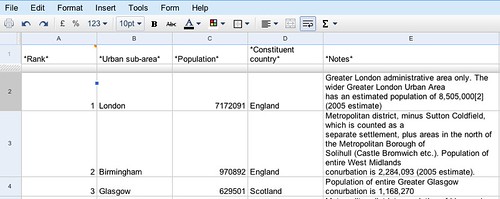
And as if by magic, a data table appears:
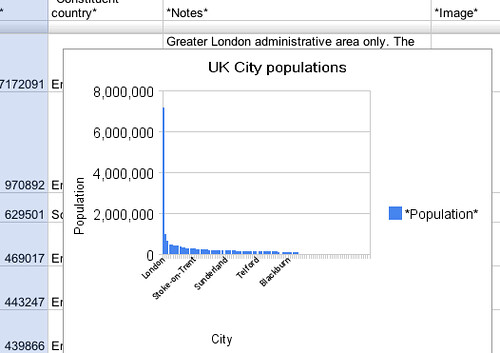
All well and good – if you want to create a chart or two, why not try the Google charting tools?
Where things get really interesting, though, is when you start letting the data flow around…
So for example, if you publish the spreadsheet you can liberate the document in a variety of formats:

As well publishing the spreadsheet as an HTML page that anyone can see (and that is pulling data from the WIkipedia page, remember), you can also get access to an RSS feed of the data – and a host of other data formats:

See the “More publishing options” link? Lurvely :-)

Let’s have a bit of CSV goodness:

Why CSV? Here’s why:

Lurvely… :-)

(NOTE – Google spreadsheets’ CSV generator can be a bit crap at times and may require some fudging (and possibly a loss of data) in the pipe – here’s an example: When a Hack Goes Wrong… Google Spreadsheets and Yahoo Pipes.)
Unfortunately, the *’s in the element names mess things up a bit, so let’s rename them (don’t forget to dump the original row of the feed (alternatively, tweak the CSV URL so it starts with row 2); we might as well create a proper RSS feed too, by making sure we at least have a title and description element in there:

Make the description a little more palatable using a regular expression to rewrite the description element, and work some magic with the location extractor block (see how it finds the lat/long co-ordinates, and adds them to each item?;-):
DEPRECATED…. The following image is the OLD WAY of doing this and is not to be recommended…

…DEPRECATED
Geocoding in Yahoo Pipes is done more reliably through the following trick – replace the Location Builder block with a Loop block into which you should insert a Location Builder Block

The location builder will look to a specified element for the content we wish to geocode:

The Location Builder block should be configured to output the geocoded result to the y:location element. NOTE: the geocode often assumes US town/city names. If you have a list of town names that you know come from a given country, you may wish to annotate them with a country identify before you try to geocode them. A regular expression block can do this:

This block says – in the title element, grab a copy of everything – .* – into a variable – (.*) – and then replace the contents of the title element with it’s original value – $1 – as well as “, UK” – $1, UK
Note that this regular expression block would need to be wired in BEFORE the geocoding Loop block. That is, we want the geocoder to act on a title element containing “Cambridge, UK” for example, rather than just “Cambridge”.
Lurvely…
And to top it all off:

And for the encore? Grab the KML feed out of the pipe:

…and shove it in a Google map:

So to recap, we have scraped some data from a wikipedia page into a Google spreadsheet using the =importHTML formula, published a handful of rows from the table as CSV, consumed the CSV in a Yahoo pipe and created a geocoded KML feed from it, and then displayed it in a YahooGoogle map.
Kewel :-)
PS If you “own” the web page that a table appears on, there is actually quote a lot you can do to either visualise it, or make it ‘interactive’, with very little effort – see Progressive Enhancement – Some Examples and HTML Tables and the Data Web for more details…
PPS for a version of this post in German, see: http://plerzelwupp.pl.funpic.de/wikitabellen_in_googlemaps/. (Please post a linkback if you’ve translated this post into any other languages :-)
PPPS this is neat – geocoding in Google spreadsheets itself: Geocoding by Google Spreadsheets.
PPPS Once you have scraped the data into a Google spreadsheet, it’s possible to treat it as a database using the QUERY spreadsheet function. For more on the QUERY function, see Using Google Spreadsheets Like a Database – The QUERY Formula and Creating a Winter Olympics 2010 Medal Map In Google Spreadsheets.

My liege,
Wow, I think I saw what I think I saw. We really have to start talking about visualizing data in a WPMu/MediaWiki environment. I will be blogging some semantic stuff I really don’t understand shortly, because you inspire me to no end.
Oh my goodness, I’m experiencing this familiar “Tony just did something I only half-get but am totally excited about” sensation…
I gotta get me to a remedial digital literacy class, like, yesterday.
tony. good shit. mike
This is really awesome, now the only thing left to do is use http://f33d.in and get updates via twitter :)
This is amazingly cool; thank you!
That made my day.
I wish I’d have realized that was possible when I did this with Jim Groom. It would have saved me a lot of time and it’s just such an elegant way to do it.
Thanks.
Tom
Brilliant and really transparent. Following your example, now anyone could do this if they wanted to (as I have done). Thanks.
Thank you for sharing. That will be very usefull.
Take a look at http://mqlx.com/~david/parallax/
Amazing mashup. More importantly the =import function in Google spreadsheets is an amazing tool for building data sets for visualization and mashup projects, thanks for some killer knowledge.
Been reading your blog for a while and this just made me shake my head… am amazed and do agree with Brian thanks!!!
Very smart, a great example of using previously disjointed assets and creating a new way of collecting and sharing data. Thank you.
Tony, you did a fine thing indeed! I’d like to see, for example, more transparency in our local government here in Katrineholm, Sweden where all documents (invoices included) with the exception of those involving personal privacy are online. Now, you offer interesting possibilities for information gathering and online publication via Wikipedia and then with Google Docs.
Really, you did an excellent job Tony. Most impressive.
This is really cool, thanks for sharing! :-)
Awesomely nifty! Really good stuff.
Really cool stuff. This is what web 3.0 should be all about. Integrating services.
The disadvantage in having so many pieces is that you have little control over how the flow should update the end results. If you want to publish data real time, you’d want to see it as fast as possible on google/yahoo maps. This is where some more work is needed.
Well done. Just a minor correction. This:
“consumed the CSV in a Yahoo pipe and created a geocoded KML feed from it, and then displayed it in a Yahoo map.”
should be:
“consumed the CSV in a Yahoo pipe and created a geocoded KML feed from it, and then displayed it in a GOOGLE map.”
Or Yahoo then Google map.
Tried duplicating your example but for some reason i always get a parse error ?
Very cool, thanks for sharing :)
Question/request:
I would like to do something like that with data from Yahoo Finance (and/or other source) for end of day market data (indexes, trading volume, advancing and declining issues, new highs/lows, etc.).
Anyone can/care to help me with that, please get in touch through the contact form on my blog (linked to in this comment, I think, but if not go to http://www.chrisco.us). Would be a paid freelance project, of course.
Thanks,
Chris
That’s some really excellent work. Great job on the write up as well.
Most populous cities in Africa –
http://pipes.yahoo.com/pipes/pipe.info?_id=Equ_eOqa3RGL1XGGrLQIDg
Fun stuff.
Wow… I think my head just exploded….
That’s impressive. I didn’t realize you could pull data in that way from a webpage in Google Spreadsheets. Nice implementation to get it to Google Maps.
how do you make sure the data you are using stays current? for example, if i took it from another website and put it on a map.
First of all – thanks for all the comments folks – and apologies for the delay in replying; I’ve been offline traveling to and from – and delivering – a presentation on mashups today… :-)
@katrineholm Uncensored – does your council have any web pages we could start to scrape?
@chrisco – I’ll be posting a follow up post in an hour or so that may be of interest?
@jq ta :-)
@stacey – the google spreadsheet polls the original HTML page every so often, so updates to the page will update the data in the spreadsheet. (Of course, if the structure of the page is changed – eg by adding or removing another table in the page before the table you want to pull out – the import function will try to import the now incorrect table; screenscraping based mashups like this are always quite brittle in that a change in the page can break the way you try to get data out of it; which is why APIs are better…:-)
The Yahoo pipe will also cache the data being pulled from the spreadsheet in the csv file.
So whilst in an ideal world, a change to the wikipedia page would immediatley be reflected each time you refreshed the map, there is “cacheing induced latency” in the google spreadsheet and the Yahoo pipe which could mean the data is potentially minutes or hours out of date… but hopefully no more than that…
As I understand it there are two ways: when you want to update something in google spreadsheets you have to click on the cell with the calculation and press enter, so that it refreshes, or use a cron job to run a script that fiddles with the spreadsheet so that it updates/grabs fresh data (don’t ask me if/how that would work)
(I just posted this on Brian’s blog, but thought I might as well post it here, given the plaudits that this is attracting…)
Of course, superficially this is fine. But if you start to look at the data, it’s rather problematic. I was surprised to see that Manchester was listed as smaller than Bristol, of all places. It was only by going to the Wikipedia page that I understood the way in which the statistics were gathered.
In short, a lot of information has been stripped out in this process. I don’t see much in the way of gain. And in fact, it’s become very misleading.
Where’s the upside?
OK, call me a cynic, but…
Or to put it another way (and in case I didn’t sound grumpy and fuddy-duddy enough the first time), the result is a USA Today style graphic, with all the apparent virtues of clarity but the real vices of decontextualized data masquerading as information. Worse, it’s framed as a multiple-choice “pop test” as though it had some kind of educational value. It doesn’t. It’s miseducation.
@Jon the intention of the post wasn’t to produce an infographic, it was to document a mashup recipe. I was looking for a data table with a list of locations that I could scrape using a Google spreadsheet, then output into a geocoding Yahoo pipe and the wikipedia page was the first thing I came across that fitted the bill…
Your comment makes an interesting point about the way data gets used, abused and inappropriately visualised, though…
Well, your mashup recipe provides an excellent case in point of the ways in which data gets used, abused, and inappropriately visualized.
The problem is not with the Wikipedia page, but with the way in which the information it contains has been repackaged.
Again, in devil’s advocate role: where’s the upside here?
@Jon “The problem is not with the Wikipedia page, but with the way in which the information it contains has been repackaged.”
Agreed – as I just posted in a reply on Brian’s Abject blog, I should have explicitly stated the provenance of the data in both the spreadsheet and each description element of the feed generated in the pipe.
Re: the visualisation being a crap one, my original intention was to visualise the actual population data in some way (I thought about something like this: http://ouseful.open.ac.uk/blogarchive/013580.html then thought better of it), but in the end I ran out of time… As I have done now – 1.40am and it’s been way too long a day to argue any more… ;-)
I second Brian:digital remedial literacy class for me too, because that looks seriously cool.
It would be neat to export the chart or map as an image, and import it into the original Wiki page, so that whenever someone updates the table on the Wiki, the map & chart are automatically updated too. I’m sure there are services which will take a screenshot of a web page. I don’t know how to export the chart, or if Wikipedia allows images to be on another site.
@chloe I think you just found another step in the chain – there is a Google maps static image API ( http://code.google.com/apis/maps/documentation/staticmaps/ ) that lets you craft a URL for a static image (gif, i think?) for a map that can be embedded in a page in the normal way (“img src=” etc)…
No time to try it now myself – but if the lazyweb fancies having a go, please post a link back here :-)
I think the phrase is ‘well impressed’. The bad news is I just wasted two days doing some tedious longhand stuff! Thanks for this post.
Hamarja,aisob ki lekhcos?kicui to buzte parlam na!!
I love this. Learning is so fun! Thanks:)
Very cool mashup. Thanks for the great writeup.
I think it’s worth pointing out that while Google’s importHTML is very cool, for many purposes selecting, cutting and pasting a table from a website into a spreadsheet (Excel, OOCalc, or Google Spreedsheets) in the standard manner will the do the job.
While less gee-whizz, it’s a bit more approachable, and a strangley overlooked ability. (There are some odd corner cases, particularly if you use Microsoft products, but simply knowing it’s possible usually means you’ll get there in the end. I find Fireox plus OpenOffice gives the best results and most powerful results. A quick Google suggests there’s a Firefox extension for people who find themselves needing to do more)
cool!
cheers
This is awesome.
Tony, I’m sorry you see this as arguing.
Again, however, it would be great if someone, anyone, could tell me the upside.
@jon i see it as an argument in the sense of – you know – a discussion with different positions that is capable of raising different perspectives and moving the, err,argument on…;-) And the upside is that it was just a sort of coherent way of demonstrating lots of separate techie mashup tricks…
@dave the problem with cur and paste is that if the original table changes, your cut and pasted data is obsolete (unless the cut and paste cuts’n’pastes a reference to the table that is then imported behind the scenes). A comment on the follow-up post to this one – https://ouseful.wordpress.com/2008/10/16/visualising-financial-data-in-a-google-spreadsheet-motion-chart/ – attempts to work out just how frequently the spreadsheet does update the data.
Tony – I’m glad you mentioned that you had posted a comment on my blog – I had yours and three or four others inexplicably in a junk folder, which I hadn’t checked in weeks.
Jon – I took a crack at describing what I see as the upside in response to your comments on my blog, and linked to an article I wrote last year… I suspect it will fail to convince you, but I hope it will give a sense why this is interesting to some of us.
-This could also be useful link http://www.trendrr.com
either port data out or into it
Well, once you can tell me what’s the upside of these “techie mashup tricks,” then that would indeed be “kewel.”
It would be marvellous if the argument could move on, but it doesn’t seem to me that you are willing to look at the issues here.
It’s shiny, shiny. And worse than useless: it’s positively unhelpful.
No wonder people’s heads are exploding. It helps if you don’t actually think about what’s going on.
Jaw-Dropping.
It’s almost like this web of interconnected services will actually happen after all…
hey so much confusion can u clarify please?
@Jon “It would be marvellous if the argument could move on, but it doesn’t seem to me that you are willing to look at the issues here.”
I’ve so lost the thread now… anywhere, here are a few answers (hopefully) of a sort:
1) no provenance – agreed; I touched on that in a previous comment and on Brian’s blog; at a more substantive level, on the point that mashups strip provenance info and context away from data – agreed: we do have a “metadata maintenance” issue here. I’ll come back to this in a moment to suggest that there may be situations where that’s okay… (err, thin ice up ahead, I suspect ;-) But generally, yes – agreed: it’s an issue; only not here, not now. This is where we try to enthuse people – then we can get on to the issues…
To pull a quote of yours from the comment thread on http://weblogs.elearning.ubc.ca/brian/archives/048641.php “Um, what is the point, then? To do something that’s “kewel”? All surface and no substance? All process and technical trickery and no actual thought or context?”
2) Part of the point was to just document for myself some whizzy techie wiring for a workshop session I ran yesterday, and rehearse a demo to finish off the session. I’ve sat through that many dull cubed presentations, I’m trying to develop my own presentation skills (a long hard slog if you’ve ever suffered one of my presentations) and figured for the w/s I needed to try and finish with some buzz in the room. Shiny shiny…. but that’s okay, because no-one remembers anything from a presentation, just whether they came away happy, dazed, bored or enthused.
3) Value generating and information displaying enterprise mashups are arguably on the way (e.g. http://www.forrester.com/Research/Document/Excerpt/0,7211,44213,00.html ); and one reason (IMHO) for this is that the barriers to entry in terms of usability are being lowered by the experimentation that’s going on in the public and beta web. Unfortunately, most people have no idea about what the hell a mashup is – not even the very idea; (this R/W/W post provides one way of trying to explain what mashups are about in an accessible-ish way: http://www.readwriteweb.com/archives/forrester_enterprise_mashups.php ) So the demo was in part to try to get across some the relative easy (and getting easier) process techniques available for putting these things together (pipelines, data transformation, etc), and leave me with an opportunity to say: “so that’s a mashup” at the end of the session.
I didn’t touch on stripping away the context and maintaining provenance info in the post because that would have BORING and is best saved for a later day – when people are at least thinking about what the consequences of mashups are having seen one possible example.
@utellit told it as they saw it: “I love this. Learning is so fun! Thanks:)” Good – yes – learning should be fun; rarely is; my view? get enthused and then do the hard work of really getting to grips with it, because you’ll be more motivated…
4) Most people are turned off by techie stuff, or techie stuff being “too hard” – how many people do you know who don’t have a concept of right-click, or it’s benefits? So I tried to tell a story that embedded some how to’s, and if you abstract away from it and start to think about what’s going on, there is some deeper stuff in there; like what sort of processing is going on in a ‘mashup’, and what the risks are…
5) Thin ice here: in an enterprise, where the data is hopefully quality data(?!), you can hopefully trust it; and if you learn how to mash it up properly, you can get value from it. The provenance is assumed – there is still a risk wrt loss of context though. Related story – you see lots of web stats reporting averages (averages? wtf? MEANS…); and this are often a total waste of time – the info is in the distribution, and the distribution is often not normal… Context gets dropped from data all the time… and the info processing that goes on is oftentimes lossy… but that’s not a problem if the info doesn’t mislead you into making a bad decision…
6) as we generate more and more data, we’re gonna have to start learning about visualisation. Many people don;t get the idea of uncovering relationships in data through visualising it; we have to start somewhere with the visualisation education programme; maps are good for that… we have to start somewhere… and if the visualisation is a bad one, in viz 101 that’s maybe not so bad because the idea is to get across the idea of doing visualisations at all. I remember physics at school: each year we were told to forget what we’d done the previous year because it was just an approximation to the truth – and we’d be doing the truth this year…
And finally, as I understand “kewel”, it’s a way of making fun of (people who use) the word cool who are maybe not the sort of people who can get away with saying cool… so I said “kewel” to suggest that I suspected people would get off on the shiny, shiny of the post… which is ok, because the path to enlightenment is a long one, and it’s important to enthuse people about this stuff in the beginning…
Phew – too long a comment – If the above doesn’t address any of your points, could you try expressing them in a different way, ‘cos I’m obviously not understanding them…
Tony, got your comment on my blog. Thanks for the inspiration. I ended up using Pipes to clean up a feed of market information for the game Eve Online, fed it to a Google Spreadsheet, and use it to calculate profit margins on the production of pretend ships and pretend guns.
Here’s my pipe and here’s a snapshot of the spreadsheet it feeds.
Not really a *real* application, but its certainly useful within the pretend world of Eve.
Chris: I love your pipe, not sure how to use it yet though. I started today thinking I would find a way to get up-to date prices for materials needed for POS operation.
I think where i’m stuck on is where to find the typeID of the item i’m looking for. My spread sheet is set up at the moment but not sure how to pull the info in.
Tony, I think that the basic issue is that what you regard as “BORING” seems to me to be rather fundamental. Indeed, it seems rather clearly to be a way of avoiding asking the question of “the consequences of mashups.”
Yes, you’ve given an example. And I’m now asking about the consequences of this process. I think that, certainly for this example, they are uniformly negative. Which is why I was asking if there were any upside to this representation of a partial, decontextualized dataset in a new environment. Again, I still see no advantages, while I see many, many disadvantages.
No doubt you’ll think I’m exaggerating, but I think that this post, and the reaction to it, is profoundly discouraging. I’m sorry to be the drag on the “kewel” party by talking about what’s so damn “BORING.” But it seems to me to be important. I’ve written up some further thoughts here.
And perhaps finally, at least for now, a quick response to your points here…
1) I think the issue is about more than provenance, though providing provenance would certainly be a leap forward. We’re agreed on that. We also agreed that at least some mashups can “strip provenance info and context away from data.” But I should make it clear that I’m not against mashups per se. Some can definitely enhance rather than degrade both data and understanding. But I do think that this question (as to whether there is enhancement or degradation, or more generally the effects of the various transformations undergone in a mashup process) needs to be front and central at all times. It would seem that that’s our basic disagreement: you want to postpone that until some unspecified later date; for now it’s “BORING” and beside the point. Again, I strongly disagree. Postponing such questions is (as I say on my blog) a textbook case of data illiteracy. Moreover, I’m disappointed that enthusiasm is allowed to overwhelm critique so easily.
2) I like interesting presentations, too. I disagree that thinking critically is necessarily boring. And I don’t like presentations that are whizzy but lack substance.
3) I’d like to believe that “value generating and information displaying enterprise mashups are arguably on the way.” I think, however, that the links you provided are rather worrying examples of quite the opposite trend: “there is plenty of money to be made selling mashup platforms. . . . Those vendor strategists that move quickly, plan a mashup strategy, and build a partner ecosystem will come out on top”. Ugh. That’s certainly a different definition of “value” than the one I would hope might come out of such tools. Ugh. And learning should be fun. But all that is fun is not learning.
4) Techie stuff can certainly be bewildering. It makes some people’s heads explode. Hence the vital importance of critical data literacy, precisely so that people “start to think about what’s going on, there is some deeper stuff in there; like what sort of processing is going on in a ‘mashup’, and what the risks are.” I’m all for this.
5) See above for my fear as to what you may mean by getting “value” from data. Meanwhile, my more basic point is that it’s not so much a question of having quality data or not: I’m happy to accept that for this purposes the Wikipedia data is of sufficient quality. What’s at stake is the ability to interpret that data. Again, that’s what I consider to be the realm of data literacy. I’m sure that some mashups, and some transformations, aid in such interpretation. Others do not. But figuring out which is which is, again, vital. It can’t be postponed.
6) Finally, I’m all for a “visualisation education programme.” But again, my comparison with the USA Today visualizations is to point out that such education needs to have critique at its core. Not necessarily enthusiasm. Or rather, surely the point is to encourage enthusiasm for critique. That’s what I see my job, at least, as being about. More broadly, as I say, it’s what I see as being the role of the university.
Ach, I just wrote a long comment in response to your six points. It seems to have got lost somewhere. Oh well.
@jon it was being held as spam for some reason (not my doing… not sure I understand how WordPress makes its spam detection decisions?); should be in the comment stream now…
Tony, no probs. No conspiracy theorizing here!
Amazing.
When I was kid, I did this kind of maps when I was at school, by using a table on some schollar book and a map. Who didn’t? What’s new? The auto-magical update through the pipes?
From the linked page at Forrester:
“The Mashup Opportunity.
How To Make Money In The Evolving Mashup Ecosystem.
Download and print PDF immediately. Price: US $775”
They will certainly make money if the sell an e-book at that price. :|
It seems the Web is becoming more and more a cash register, an entertainement place, than a place to share documents and scientific data. Nothing wrong with that, my job at work is creating commercial/entertaining sites for small/medium business.
Really interesting. I”m looking for ways to integrate public data into my companies’ data warehouse. Thanks you for posting this.
BTW: you can do that with MS Excel since Office XP (I think). Data->Import External Data->New Web Query. Click on one or more of the arrows to switch it to a green checkmark and press the “Import” button.
Works even with password protected websites, Excel will ask you for your login data when you open the spreadsheet then.
So. Awesome.
Do you mind if I show this off to people?
If I have name and address only(Japan Language) , I would like to show location how can do. I try to do many an hour but Y Location not appears.
Plz Help Me —
Really great.
But some cities aren’t on the right place(?)
Same problem to me with this Article:
http://de.wikipedia.org/wiki/Liste_der_gr%C3%B6%C3%9Ften_St%C3%A4dte_der_EU
and the result:
http://pipes.yahoo.com/pipes/pipe.info?_id=Msa1t9Ol3RGccWE1rbQIDg
seem, that the missing cities lay over the last found city
Does anyone have an idea to fix this problem?
Many greetings
plerzel ;-)
Stunning!
You made me to study geocoding by Spreadsheets.
Yes, you can geocode on Spreadsheets
http://apitricks.blogspot.com/2008/10/geocoding-by-google-spreadsheets.html
Still you need Pipes for KML. Funny.
Thank you ESA – Great
pipes find all cities on the right places :-))
Has anyone figured out how to use a published Google spreadsheet as an external data source for Excel?
here is the result:
http://spreadsheets.google.com/pub?key=pxzkeQcRyg0BCEm2IKxZiBg
http://pipes.yahoo.com/pipes/pipe.info?_id=Msa1t9Ol3RGccWE1rbQIDg
thank you all for your help :-)
thanks again. I wrote a german article in my blog about that.
For those who are interested…..
thanks again. I wrote a german article in my blog about that.
For those who are interested…..
http://plerzelwupp.pl.funpic.de/wikitabellen_in_googlemaps/
Great, plerzelwupp
I can see that you geocode by Spreadsheets but do the KML conversion by Pipes.
MANO!
thank you, ESA – I mixed your proposal (geocode by google) with this one (kml by pipes) …. the pipes location extractor works better, when you feed it with longitude and latitude. Google nearly found every of those 52 cities (except of four). The last 4 cities where found, as I feeded google with city and country (not only city).
Thanks again, Tony and Esa – and many greetings from germany
Help ME PLZ, I do not known why map not shown , Please recommend Plz !!!!
Thx so lots
Pips has problem
http://pipes.yahoo.com/pipes/pipe.info?_id=5rBrVlqp3RGmRzxlbbsjiw
I confuse a thing , My pipe show Lat and long ,but when I run Pipe the map not appear , just show list.
How can I fix this problem.
Plz Help me, (:
My pipe which has problem
http://pipes.yahoo.com/pipes/pipe.info?_id=5rBrVlqp3RGmRzxlbbsjiw
This is awesome! Thanks!
Thanks so much for this awesome post. The only issue I have is that the wiki I want to scrape data from is behind a firewall and cannot be accessed without signing in. I wonder is there anyway out of this because it’s RSS feeds etc cannot be accessed externally. I’m looking at some mediawiki extension that might push the wiki page data externally so I can then use google spreadsheet, yahoo pipes etc. Any ideas?
@richard
It won’t be approved of, but if you have a DMZ server that sits on the internal network (ie can see internal URLs) and also faces outside, you can set up a simple proxy that will relay the feed into the public domain…
Of course, I can’t recommend such practice ;-)
If the login to the wiki is via http, then you may be able to pass user id and pwd in via URL. That is, if you can get a feed out using something like http://example.com/feed.xml?id=myID&password=secret
Great post! This inspired me to write a blog post about my personal technique for geocoding spreadsheets data:
http://otherfancystuff.blogspot.com/2008/11/geocoding-with-google-spreadsheets-and.html
http://www.alpheta.com – please take a look if you’re interesed in data scraping
how do you copy and paste the url in to the query ()in google doc’s. it wont allow me too
Can you pass pwd and user ID in url?
Here is a post regarding techniques for ‘Scraping your way to RSS feeds’ albeit in a non-programmatic (layman) way:
http://technosiastic.wordpress.com/2009/04/08/scraping-your-way-to-rss-feeds/
Hi,
I have tried to do the first step (importHTML) in Google Docs and it does not work with comma (,) separator, but changed to semi-colon (;) and worked fine.
Great article, congratulations!
I wanted to ask if someone out there might be able to demonstrate how I could introduce into my map a third data point to display. Right now I have the location and name displaying but also need the date if at all possible. Any ideas?
Well done!
I wrote a blog post doing something related; how to create a server monitor using a Google Spreadsheet and a little PHP.
http://stephenakins.blogspot.com/2009/04/google-docs-server-monitoring_8546.html
I have some ideas about how to create some other stuff using approaches like these.
This is plain lovely, and Jon’s comments are useful too. I’m curious why the resulting map on both Pipes and Google Maps only shows certain cities/towns?
The Yahoo pipes geocoder is a little hit or miss, and sometimes doesn’t disambiguate or identfy placenames so well; if a placename isn’t recognised and geocoded, then that item doesn’t get plotted.
What I really need to get round to doing is looking at using something like Yahoo Placemaker to see if it’s any more reliable (I don’t think the Pipes Location Extractor is Placemaker… though I’d have to run a few tests to check…)
I found this article very inspiring. I would love to know if there is a way to flatten nested tables e.g. table>tr>td*3>table>tr>td*2 would become talbe>tr>td*4 (hope you understand this zen html syntax) nested tables are a mess! But I guess this is what data scraping is all about, getting data from information sources that are messy :)
I haven’t found a way of handling the import of nested tables using Google spreadsheets yet… :-(
That’s great! Otherwise you can go through APIs from services like freebase, but going direct means you get the most recent data.
We went direct with our Wikipedia Google Maps mashup. http://maps.thefullwiki.org We went through the entire Wikipedia dump and created a map for each article showing each location.
this is really cool, thanks for this info in using google spreedsheet.. thanks
Thank you very much for sharing this info. I’m using Yahoo! pipes for quite a while, but I never thought to generate mash-up like this.
Very useful. I will have a try just to make a bit more practice.
Enjoy the rest of your day.
FYI: The formula for scraping with a Google Spreadsheet has changed (or there is a typo here).
It’s =importhtml(“”,”table”,N) – ie there’s an “L” after the HTM.
Super useful post though – thanks…
Arghh – no – typo.. well spotted: thanks:-)
Hi, this is pretty interesting. Thanks for sharing.
I have been working on a plugin for WordPress that helps to import data into individual WP posts.
I think you can try it or might be useful. http://wordpress.org/extend/plugins/wpsync/
I am envisioning to use your technique so I can build a site quickly from data processed with pipes using your approach. Thanks.
use yql
yahoo developer network
With havin so much content and articles do you ever run into any issues of plagorism or copyright violation?
My blog has a lot of unique content I’ve either created myself or outsourced but it looks like a lot of it is popping it up all over the internet without my agreement. Do you know any methods to help prevent content from being stolen? I’d genuinely appreciate it.
hoca mükemmelsin yahu
Hiya! I know this is kinda off topic nevertheless I’d figured I’d ask.
Would you be interested in exchanging links or maybe guest authoring a blog article
or vice-versa? My site goes over a lot of the same subjects
as yours and I believe we could greatly benefit from each
other. If you’re interested feel free to send me an e-mail. I look forward to hearing from you! Excellent blog by the way!
Awesome. Now I just need to work out how to do it on a private (ie logon required) site, as I have loads of data i could manipulate that i can’t really get to otherwise, any ideas?
Can’t get my pipes to work. any ideas? i can get it in the correct format using this =QUERY(ImportHtml(“http://en.wikipedia.org/wiki/List_of_largest_United_Kingdom_settlements_by_population”,”table”,2),”SELECT Col1, Col2, Col3 LABEL Col1 ‘rank’, Col2 ‘city’, Col3 ‘population'”)
in google docs, but it is not showing up correcting in pipes. Appreciate any help!!
Very nice, elaborate tutorial. Decided to write one myself on leveraging ImportHTML() to make a cool map visualization of facebook usage data.
Let me know what you think: http://spreadsheetpro.net/using-importhtml-to-scrape-facebook-usage-numbers/
I get pleasure from, cause I found just what I was having a look
for. You have ended my 4 day long hunt! God Bless you man.
Have a great day. Bye