Another set of stepping stones that provide a clunky route to a solution that @mhawksey has been working on a far more elegant expression of (eg Free the tweets! Export TwapperKeeper archives using Google Spreadsheet and Twitter: How to archive event hashtags and create an interactive visualization of the conversation)…
The recipe is as follows:
– download a Twapperkeeper archive to a CSV file using a Python script as described in Python Script for Exporting (Large) Twapperkeeper Archives By User; the CSV file should contain a single column with one row per archive entry; each row includes the sender, the tweet, the tweet ID and a timestamp; **REMEMBER – TWAPPERKEEPER ARCHIVES WILL BE DISABLED ON JAN 6TH, 2012**
– in an R environment (I use RStudio), reuse code from Rescuing Twapperkeeper Archives Before They Vanish and Cornelius Puschmann’s post Generating graphs of retweets and @-messages on Twitter using R and Gephi:
require(stringr)

#A helper function to remove @ symbols from user names...
trim <- function (x) sub('@','',x)

twapperkeeperCSVParse=function(fp){
    df = read.csv(fp, header=F)
    df$from=sapply(df$V1,function(tweet) str_extract(tweet,"^([[:alnum:]_]*)"))
    df$id=sapply(df$V1,function(tweet) str_extract(tweet,"[[:digit:]/s]*$"))
    df$txt=sapply(df$V1,function(tweet) str_trim(str_replace(str_sub(str_replace(tweet,'- tweet id [[:digit:]/s]*$',''),end=-35),"^([[:alnum:]_]*:)",'')))
    df$to=sapply(df$txt,function(tweet) trim(str_extract(tweet,"^(@[[:alnum:]_]*)")))
    df$rt=sapply(df$txt,function(tweet) trim(str_match(tweet,"^RT (@[[:alnum:]_]*)")[2]))
    return(df)
}
#usage:
#twarchive.df=twapperkeeperCSVParse("PATH_TO_YOUR_FILE")
#For example:
df=twapperkeeperCSVParse("~/code/twapps/reports/twArchive_online11.txt")

ats.df <- data.frame(df$from,df$to)
rts.df <- data.frame(df$from,df$rt)

#Cribbing http://blog.ynada.com/339
require(igraph)
ats.g <- graph.data.frame(ats.df, directed=T)
rts.g <- graph.data.frame(rts.df, directed=T)

write.graph(ats.g, file="ats.graphml", format="graphml")
write.graph(rts.g, file="rts.graphml", format="graphml")
– Cornelius’ code uses the igraph library to construct a graph and export graphml files that describe graphs of at behaviour (tweets in the archive sent from one user to another) and RT behaviour (tweets from one person retweeting another using the RT @name convention).
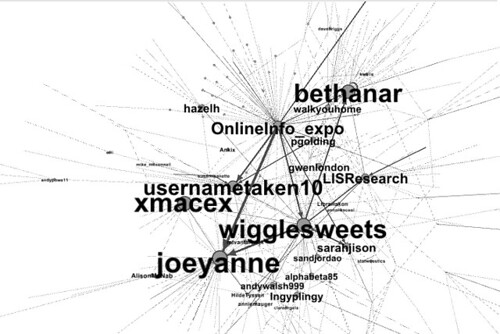
– visualise the graphml files in Gephi. Note a couple of things – empty nodes aren’t handled properly in my version of the code, so the graph includes a dummy node that all non-at or non-RT row tweet senders point to; when you visualise the graph, this node will be obvious, so just delete it ;-)
– the Gephi visualisation by default uses the Label attribute for labeling nodes – we need to change this:

You should now be able to view graphs that illustrate RT or @ behaviour as captured in a Twapperkeeper archive in Gephi.
Just by the by, we can also generate stats’n graphs of the contents of the archive. For example, via Getting Started With Twitter Analysis in R, we can generate a bar plot to show who was retweeted most:
require(ggplot2)

ggplot()+geom_bar(aes(x=na.omit(df$rt)))+opts(axis.text.x=theme_text(angle=-90,size=6))+xlab(NULL)
We can also do some counting to find out who was RT’d the most, for example:
#count the occurrences of each name in the rt column
rt.count=data.frame(table(df$rt))
#sort the results in descending order and display the top 5 results
head(rt.count[order(-rt.count$Freq),],5)
#There are probably better ways of doing that! If so, let me know via comments
Next on the to do list is:
– automate the production of archive reports
– work in the time component so we can view behaviour over time in Gephi… (here’s a starting point maybe, again from Cornelius Puschmann’s blog: Dynamic Twitter graphs with R and Gephi (clip and code))
As things stand though, I may not be able to get round to either of those for a while…

I’ve found on the site:
Twapper Keeper’s archiving is now available in HootSuite! As a result, we will be shutting down Twapper Keeper. Existing archives will be kept running until Jan 6, 2012, after which you will not be able to access your archives anymore.
Thanks for using TwapperKeeper – we look forward to seeing you at HootSuite.
And I cannot get any reports …
You just wrote the post a few days ago, how did you get the tweets since it will shutdown?
I wrote some scripts to export Twapperkeeper archives:
Python Script for Exporting (Large) Twapperkeeper Archives By User [ https://blog.ouseful.info/2011/12/12/python-script-for-exporting-large-twapperkeeper-archives-by-user/ ]
Rescuing Twapperkeeper Archives Before They Vanish, Redux [ https://blog.ouseful.info/2011/12/11/rescuing-twapperkeeper-archives-before-they-vanish-redux/ ]