Filtering Guardian University Data Every Which Way You Can…

In a post from way back when – Does Funding Equal Happiness in Higher Education? – that I still get daily traffic to, though the IBM Many Eyes Wikified hack described in it no longer works, I aggregated and reused a selection of data sets collected by the Guardian datastore relating to HE.

Whilst the range of datasets used in that hack don’t seem to have been re-collected more recently, the Guardian DataStore does still publish and annual set of aggregated data (from Unistats?) for courses by subject area across UK HE (University guide 2013 – data tables).

The DataStore data is published using Google spreadsheets, which as regular readers will know also double up as a database. The Google Visualisation API that’s supported by Google Spreadsheets also makes it easy to pull data from the spreadsheets into an interactive dashboard view.

As an example, I’ve popped a quick demo up as a Scraperwiki View showing how to pull data from a selected sheet within the Guardian University data spreadsheet and filter it using a range of controls. I’ve also added a tabular view, and a handful of scatterplots, to show off the filtered data.

To play with the view, visit here: Guardian Student Rankings.

If you want to hack around with the view, it’s wikified here: wikified source code.

PS I’ve also pulled all the subject data tables into a single Scraperwiki database: Guardian HE Data 2013

From Communications Data to #midata – with a Mobile Phone Data Example

A BIS Press Release (Next steps making midata a reality) seems to have resulted in folk tweeting today about the #midata consultation that was announced last month. If you haven’t been keeping up, #midata is the policy initiative around getting companies to make “[consumer data] that may be actionable and useful in making a decision or in the course of a specific activity” (whatever that means) available to users in a machine readable form. To try to help clarify matters, several vignettes are described in this July 2012 report – Example applications of the midata programme – which plays the role of a ‘draft for discussion’ at the September midata Strategy Board [link?]. Here’s a quick summary of some of them:

  • form filling: a personal datastore will help you pre-populate forms and provide certified evidence of things like: proof of her citizenship, qualified to drive, passed certain exams and achieved certain qualifications, passed a CRB check, and so on. (Note: I’ve previously tried to argue the case for the OU starting to develop a service (OU Qualification Verification Service) around delivering verified tokens relating to the award of OU degrees, and degrees awarded by the polytechnics, as was (courtesy of the OU’s CNAA Aftercare Service), but after an initial flurry of interest, it was passed on. midata could bring it back maybe?
  • home moving admin: change your details in a personal “mydata” data store, and let everyone pick up the changes from there. Just think what fun you could have with an attack on this;-)
  • contracts and warranties dashboard: did my crApple computer die the week before or after the guarantee ran out?
  • keeping track of the housekeeping: bank and financial statement data management and reporting tools. I thought there already was software for doing this? do we use it though? I’d rather my bank improved the tools it provided me with?
  • keeping up with the Jones’s: how does my house’s energy consumption compare with that of my neighbours?
  • which phone? Pick a tariff automatically based on your actual phone usage. From going through this recently, the problem is not with knowing how I use my phone (easy enough to find out), it’s with navigating the mobile phone sites trying to understand their offers. (And why can’t Vodafone send me an SMS to say I’m 10 minutes away from using up this month’s minutes, rather than letting me go over? The midata answer might be an agent that looks at my usage info and tells me when I’m getting close to my limit, which requires me having access to my contract details in a machine readable form, I guess?

And here’s a BIS blog post summarising them: A midata future: 10 ways it could shape your choices.

(The #midata policy seems based on a belief that users want better access to data so they can do things with it. I’m not convinced – why should I have to export my bank data to another service (increasing the number of services I must trust) rather than my bank providing me with useful tools directly? I guess one way this might play out is that any data that does dribble out may get built around by developers who then sell the tools back to the data providers so they can offer them directly? In this context, I guess I should read the BIS commissioned Jigsaw Research report: Potential consumer demand for midata.)

Today has also seen a minor flurry of chat around the call for evidence on the Communications Data Bill, presumably because the closing date for responses is tomorrow (draft Communications Data Bill). (Related reading: latest Annual Report of the Interception of Communications Commissioner.) Again, if you haven’t been keeping up, the draft Communications Data Bill describes communications data in the following terms:

  • Communications data is information about a communication; it can include the details of the time, duration, originator and recipient of a communication; but not the content of the communication itself
  • Communications data falls into three categories: subscriber data; use data; and traffic data.

The categories are further defined in an annex:

  • Subscriber Data – Subscriber data is information held or obtained by a provider in relation to persons to whom the service is provided by that provider. Those persons will include people who are subscribers to a communications service without necessarily using that service and persons who use a communications service without necessarily subscribing to it. Examples of subscriber information include:
    – ‘Subscriber checks’ (also known as ‘reverse look ups’) such as “who is the subscriber of phone number 012 345 6789?”, “who is the account holder of e-mail account xyz@xyz.anyisp.co.uk?” or “who is entitled to post to web space http://www.xyz.anyisp.co.uk?”;
    – Subscribers’ or account holders’ account information, including names and addresses for installation, and billing including payment method(s), details of payments;
    – information about the connection, disconnection and reconnection of services which the subscriber or account holder is allocated or has subscribed to (or may have subscribed to) including conference calling, call messaging, call waiting and call barring telecommunications services;
    – information about the provision to a subscriber or account holder of forwarding/redirection services;
    – information about apparatus used by, or made available to, the subscriber or account holder, including the manufacturer, model, serial numbers and apparatus codes.
    – information provided by a subscriber or account holder to a provider, such as demographic information or sign-up data (to the extent that information, such as a password, giving access to the content of any stored communications is not disclosed).
  • Use data – Use data is information about the use made by any person of a postal or telecommunications service. Examples of use data may include:
    – itemised telephone call records (numbers called);
    – itemised records of connections to internet services;
    – itemised timing and duration of service usage (calls and/or connections);
    – information about amounts of data downloaded and/or uploaded;
    – information about the use made of services which the user is allocated or has subscribed to (or may have subscribed to) including conference calling, call messaging, call waiting and call barring telecommunications services;
    – information about the use of forwarding/redirection services;
    – information about selection of preferential numbers or discount calls;
  • Traffic Data – Traffic data is data that is comprised in or attached to a communication for the purpose of transmitting the communication. Examples of traffic data may include:
    – information tracing the origin or destination of a communication that is in transmission;
    – information identifying the location of equipment when a communication is or has been made or received (such as the location of a mobile phone);
    – information identifying the sender and recipient (including copy recipients) of a communication from data comprised in or attached to the communication;
    – routing information identifying equipment through which a communication is or has been transmitted (for example, dynamic IP address allocation, file transfer logs and e-mail headers – to the extent that content of a communication, such as the subject line of an e-mail, is not disclosed);
    – anything, such as addresses or markings, written on the outside of a postal item (such as a letter, packet or parcel) that is in transmission;
    – online tracking of communications (including postal items and parcels).

    To put the communications data thing into context, here’s something you could try for yourself if you have a smartphone. Using something like the SMS to Text app (if you trust it!), grab your txt data from your phone and try charting it: SMS analysis (coming from an Android smartphone or an IPhone). And now ask yourself: what if I also mapped my location data, as collected by my phone? And will this sort of thing be available as midata, or will I have to collect it myself using a location tracking app if I want access to it? (There’s an asymmetry here: the company potentially collecting the data, or me collecting the data…)

    It’s also worth bearing in mind that even if access to your data is locked down, access to the data of people associated with you might reveal quite a lot of information about you, including your location, as Adam Sadilek et al. describe: Finding Your Friends and Following Them to Where You Are (see also Far Out: Predicting Long-Term Human Mobility). My own tinkerings with emergent social positioning (looking at who the followers of particular twitter users also follow en masse) also suggest we can generate indicators about potential interests of a user by looking at the interests of their followers… Even if you’re careful about who your friends are, your followers might still reveal something about you you have tried not to disclose yourself (such as your birthday…). (That’s one of the problems with asymmetric trust models! Hmmm… could be interesting to start trying to model some of this… )

    Both of these consultations provide a context for reflecting on the extent to which companies use data for their own processing purposes (for a recent review, see What happens to my data? A novel approach to informing users of data processing practices), the extent to which they share this data in raw and processed form with other companies or law enforcement agencies, the extent to which they may use it to underwrite value-added/data-powered services to users directly or when combined with data from other sources, the extent to which they may be willing to share it in raw or processed form back with users, and the extent to which users may then be willing (or licensed) to share that data with other providers, and/or combine it with data from other providers.

    One of the biggest risks from a “what might they learn about me” point of view – as well as some of the biggest potential benefits – comes from the reconciliation of data from multiple different sources. Mosaic theory is an idea taken from the intelligence community that captures the idea that when data from multiple sources is combined, the value of the whole view may be greater than the sum of the parts. When privacy concerns are idly raised as a reason against the release of data, it is often suspicion and fears around what a data mosaic picture might reveal that act as drivers of these concerns. (Similar fears are also used as a reason against the release of data, for example under Freedom of Information requests, in case a mosaic results in a picture that can be used against national interests: eg D.E. Pozen, The Mosaic Theory, National Security, and the Freedom of Information Act and MP Goodwin, A National Security Puzzle: Mosaic Theory and the First Amendment Right of Access in the Federal Courts).

    Note that within a particular dataset, we might also appeal to mosaic theory thinking; for example, might we learn different things when we observe individual data records as singletons, as opposed to a set of data (and the structures and patterns it contains) as a single thing: GPS Tracking and a ‘Mosaic Theory’ of Government Searches. And as a consequence, might we want to treat individual data records, and complete datasets, differently?

    PS via this ORG post – Consulympics: opportunities to have your say on tech policies – which details a whole raft of currently open ICT related consultations in the UK, I am reminded of this ICO Consultation on the draft Anonymisation code of practice along with a draft of the anaoymisation code itself.

    Pragmatic Visualisation – GDS Transaction Data as a Treemap

    A week or two ago, the Government Data Service started publishing a summary document containing website transaction stats from across central government departments (GDS: Data Driven Delivery). The transactional services explorer uses a bubble chart to show the relative number of transactions occurring within each department:

    The sizes of the bubbles are related to the volume of transactions (although I’m not sure what the exact relationship is?). They’re also positioned on a spiral, so as you work clockwise round the diagram starting from the largest bubble, the next bubble in the series is smaller (the “Other” catchall bubble is the exception, sitting as it does on the end of the tail irrespective of its relative size). This spatial positioning helps communicate relative sizes when the actual diameter of two bubbles next to each other is hard to differentiate between.

    Clicking on a link takes you down into a view of the transactions occurring within that department:

    Out of idle curiosity, I wondered what a treemap view of the data might reveal. The order of magnitude differences in the number of transactions across departments meant the the resulting graphic was dominated by departments with large numbers of transactions, so I did what you do in such cases and instead set the size of the leaf nodes in the tree to be the log10 of the number of transactions in a particular category, rather than the actual number of transactions. Each node higher up the tree was then simply the sum of values in the lower levels.

    The result is a treemap that I decided shows “interestingness”, which I defined for the purposes of this graphic as being some function of the number and variety of transactions within a departement. Here’s a nested view of it, generated using a Google chart visualisation API treemap component:

    The data I grabbed had a couple of usable structural levels that we can make use of in the chart. Here’s going down to the first level:

    …and then the second:

    Whilst the block sizes aren’t really a very good indicator of the number of transactions, it turns out that the default colouring does indicate relative proportions in the transaction count reasonably well: deep red corresponds to a low number of transactions, dark green a large number.

    As a management tool, I guess the colours could also be used to display percentage change in transaction count within an area month on month (red for a decrease, green for an increase), though a slightly different size transformation function might be sensible in order to draw out the differences in relative transaction volumes a little more?

    I’m not sure how well this works as a visualisation that would appeal to hardcore visualisation puritans, but as a graphical macroscopic device, I think it does give some sort of overview of the range and volume of transactions across departments that could be used as an opening gambit for a conversation with this data?

    Whither Transparency? This Week in Open Data

    I’m starting to feel as if I need to do myself a weekly round-up, or newsletter, on open data, if only to keep track of what’s happening and how it’s being represented. Today, for example, the Commons Public Accounts Committee published a report on Implementing the Transparency Agenda.

    From a data wrangling point of view, it was interesting that the committee picked up on the following point in its Conclusions and recommendations (thanks for the direct link, Hadley:-), whilst also missing the point…:

    2. The presentation of much government data is poor. The Cabinet Office recognises problems with the functionality and usability of its data.gov.uk portal. Government efforts to help users access data, as in crime maps and the schools performance website, have yielded better rates of access. But simply dumping data without appropriate interpretation can be of limited use and frustrating. Four out of five people who visit the Government website leave it immediately without accessing links to data. So there is a clear benefit to the public when government data is analysed and interpreted by third parties – whether that be, for example, by think-tanks, journalists, or those developing online products and smartphone applications. Indeed, the success of the transparency agenda depends on such broader use of public data. The Cabinet Office should ensure that:
    – the publication of data is accessible and easily understood by all; and
    – where government wants to encourage user choice, there are clear criteria to determine whether government itself should repackage information to promote public use, or whether this should be done by third parties.

    A great example of how data not quite being published consistently can cause all sorts of grief when trying to aggregate it came to my attention yesterday via @lauriej:

    It leads to a game where you can help make sense of not quite right column names used to describe open spending data… (I have to admit, I found the instructions a little hard to follow – a screenshot walked through example would have helped? It is, after all, largely a visual pattern matching exercise…)

    From a spend mapping perspective, this is also relevant:

    6. We are concerned that ‘commercial confidentiality’ may be used as an inappropriate reason for non-disclosure of data. If transparency is to be meaningful and comprehensive, private organisations providing public services under contract must make available all relevant public information. The Cabinet Office should set out policies and guidance for public bodies to build full information requirements into their contractual agreements, in a consistent way. Transparency on contract pricing which is often hidden behind commercial confidentiality clauses would help to drive down costs to the taxpayer.

    And from a knowing “what the hell is going on?” perspective, there was also this:

    7. Departments do not make it easy for users to understand the full range of information available to them. Public bodies have not generally provided full inventories of all of the information they hold, and which may be available for disclosure. The Cabinet Office should develop guidance for departments on information inventories, covering, for example, classes of information, formats, accuracy and availability; and it should mandate publication of the inventories, in an easily accessible way.

    The publication of government department open data strategies may go some way to improving this. I’ve also been of a mind that more accessible ways of releasing data burden reporting requirements could help clarify what “working data” is available, in what form, and the ways in which it is routinely being generated and passed between bodies. Sorting out better pathways between FOI releases of data and the then regular release of such data as opendata is also something I keep wittering on about (eg FOI Signals on Useful Open Data? and The FOI Route to Real (Fake) Open Data via WhatDoTheyKnow).

    From within the report, I also found a reiteration of this point notable:

    This Committee has previously argued that it is vital that we and the public can access data from private companies who contract to provide public services. We must be able to follow the taxpayers’ pound wherever it is spent. The way contracts are presently written does not enable us to override rules about commercial confidentiality. Data on public contracts delivered by private contractors must be available for scrutiny by Parliament and the public. Examples we have previously highlighted include the lack of transparency of financial information relating to the Private Finance Initiative and welfare to work contractors.

    …not least because data releases from companies is also being addressed on another front, midata, most notably via the recently announced BIS Midata 2012 review and consultation [consultation doc PDF]. For example, the consultation document suggests:

    1.10 The Government is not seeking to require the release of data electronically at this stage, and instead is proposing to take a power to do so. The Secretary of State would then have to make an order to give effect to the power. An order making power, if utilised, would compel suppliers of services and goods to provide to their customers, upon request, historic transaction/ consumption data in a machine readable format. The requirement would only apply to businesses that already hold this information electronically about individual consumers.
    1.11. Data would only have to be released electronically at the request of the consumer and would be restricted to an individual’s consumption and transaction data, since in our view this can be used to better understand consumers’ behaviour. It would not cover any proprietary analysis of the data, which has been done for its own purposes by the business receiving the request.

    (More powers to the Minister then…?!) I wonder how this requirement would extend rights available under the Data Protection Act (and why couldn’t that act be extended? For example, Data Protection Principle 6 includes “a right of access to a copy of the information comprised in their personal data” – couldn’t that be extended to include transaction data, suitably defined? Though I note 1.20. There are a number of different enforcement bodies that might be involved in enforcing midata. Data protection is enforced by the Information Commissioner’s Office (ICO), whilst the Office of Fair Trading (OFT), Trading Standards and sector regulators currently enforce consumer protection law. and Question 17: Which body/bodies is/are best placed to perform the enforcement role for this right?) There are so many bits of law around relating to data that I don’t understand at all that I think I need to do myself an uncourse on them… (I also need to map out the various panels, committees and groups that have an open data interest… The latest, of course, is the Open Data User Group (ODUG), the minutes of whose first meeting were released some time ago now, although not in a directly web friendly format…)

    The consultation goes on:

    1.18. For midata to work well the data needs be made available to the consumer in electronic format as quickly as possible following a request (maybe immediately) and as inexpensively as possible. This will minimise friction and ensure that consumers are able to access meaningful data at the point it is most useful to them. This requirement will only cover data that is already held electronically at the time of the request so we expect that the time needed to respond to a consumer’s request will be short – in many cases instant

    Does the Data Protection Act require the release of data in an electronic format, and ideally a structured electronic format (i.e. as something resembling a dataset? The recent Protection of Freedoms Act amended the FOI Act with language relating to the definition and release of datasets, so I wonder if this approach might extend elsewhere?

    Coming at the transparency thing from another direction, I also note with interest (via the BBC) that MPs say all lobbyists should be on new register:

    All lobbyists, including charities, think tanks and unions, should be subject to new lobbying regulation, a group of MPs have said. They criticised government plans to bring in a statutory register for third-party lobbyists, such as PR firms, only. They said the plan would “do nothing to improve transparency”. Instead, the MPs said, regulation should be brought in to cover all those who lobby professionally.

    This is surely a blocking move? If we can’t have a complete register, we shouldn’t have any register. So best not to have one at all for a year or two.. or three… or four… Haven’t they heard of bootstrapping and minimum viability releases?! Or maybe I got the wrong idea from the lead I took from the start of the news report? I guess I need to read what the MPs actually said in the Political and Constitutional Reform – Second Report: Introducing a statutory register of lobbyists.

    PS For a round-up of other recent reports on open data, see OpenData Reports Round Up (Links…).

    PPS This is also new to me: new UK Data Service “starting on 1 October 2012, [to] integrate the Economic and Social Data Service (ESDS), the Census Programme, the Secure Data Service and other elements of the data service infrastructure currently provided by the ESRC, including the UK Data Archive.”

    Olympics Data Feeds – Scribbled Notes

    This is so much a blog post as a dumping ground for bits and pieces relating to Olympics data coverage…

    BBC Internet blog: Olympic Data Services and the Interactive Video Player – has a brief overview of how the BBC gets its data from LOCOG; and Building the Olympic Data Services describes something of the technical architecture.

    ODF Data Dictionaries eg ODF Equestrian Data Dictionary [via @alisonw] – describes how lots of data that isn’t available to mortals is published ;-)

    Computer Weekly report from Sept 2011: Olympic software engineers enter final leg of marathon IT development project

    Examples of some of the Olympics related products you can buy from the Press Association: Press Association: Olympics Graphics (they also do a line of widgets…;-)

    I haven’t found a public source of press releases detailing results that has been published as such (seems like you need to register to get them?) but there are some around if you go digging (for example, gymnastics results, or more generally, try a recent websearch for something like this: "report created" site:london2012.olympics.com.au filetype:pdf olympics results).

    A search for medallists on Freebase (via @mhawksey), and an example of how to query for just the gold medal winners.

    [PDFs detailing biographical details of entrants to track and field events at lease: games XXX olympiad biographical inurl:www.iaaf.org/mm/Document/ filetype:pdf]

    A really elegant single web page app from @gabrieldance: Was an Olympic Record Set Today? Great use of the data…:-)

    This also makes sense – Journalism.co.uk story on how Telegraph builds Olympics graphics tool for its reporters to make it easy to generate graphical views over event results.

    PS though it’s not data related at all, you may find this amusing: OU app for working out which Olympic sport you should try out… Olympisize Me (not sure how you know it was an OU app from the landing page though, other than by reading the URL…?)

    PPS I tweeted this, but figure it’s also worth a mention here: isn’t it a shame that LOCOG haven’t got into the #opendata thing with the sports results…

    Searching for a Map of Designated Public Places…

    A discussion, earlier, about whether it was now illegal to drink in public…

    …I thought not, think not, at least, not generally… My understanding was, that local authorities can set up controlled, alcohol free zones and create some sort of civil offence for being caught drinking alcohol there. (As it is, councils can set up regions where public consumption of alcohol may be prohibited and this prohibition may be enforced by the police.) So surely there must be an #opendata powered ‘no drinking here’ map around somewhere? The sort of thing that might result from a newspaper hack day, something that could provide a handy layer on a pub map? I couldn’t find one, though…

    I did a websearch, turned up The Local Authorities (Alcohol Consumption in Designated Public Places) Regulations 2007, which does indeed appear to be the bit of legislation that regulates drinking alcohol in public, along with a link to a corresponding guidance note: Home Office circular 013 / 2007:

    16. The provisions of the CJPA [Criminal Justice and Police Act 2001, Chapter 2 Provisions for combatting alcohol-related disorder] should not lead to a comprehensive ban on drinking in the open air.

    17. It is the case that where there have been no problems of nuisance or annoyance to the public or disorder having been associated with drinking in that place, then a designation order … would not be appropriate. However, experience to date on introducing DPPOs has found that introducing an Order can lead to nuisance or annoyance to the public or disorder associated with public drinking being displaced into immediately adjacent areas that have not been designated for this purpose. … It might therefore be appropriate for a local authority to designate a public area beyond that which is experiencing the immediate problems caused by anti-social drinking if police evidence suggests that the existing problem is likely to be displaced once the DPPO was in place. In which case the designated area could include the area to which the existing problems might be displaced.

    Creepy, creep, creep…

    This, I thought, was interesting too, in the guidance note:

    37. To ensure that the public have full access to information about designation orders made under section 13 of the Act and for monitoring arrangements, Regulation 9 requires all local authorities to send a copy of any designation order to the Secretary of State as soon as reasonably practicable after it has been made.

    38. The Home Office will continue to maintain a list of all areas designated under the 2001 Act on the Home Office website: www.crimereduction.gov.uk/alcoholorders01.htm [I’m not convinced that URL works any more…?]

    39. In addition, local authorities may wish to consider publicising designation orders made on their own websites, in addition to the publicity requirements of the accompanying Regulations, to help to ensure full public accessibility to this information.

    So I’m thinking: this sort of thing could be a great candidate for a guidance note from the Home Office to local councils recommending ways of releasing information about the extent of designation orders as open geodata. (Related? Update from ONS on data interoperability (“Overcoming the incompatibility of statistical and geographic information systems”).)

    I couldn’t immediately find a search on data.gov.uk that would turn up related datasets (though presumably the Home Office is aggregating this data, even if it’s just in a filing cabinet or mail folder somewhere*), but a quick websearch for Designated Public Places site:gov.uk intitle:council turned up a wide selection of local council websites along with their myriad ways of interpreting how to release the data. I’m not sure if any of them release the data as geodata, though? Maybe this would be an appropriate test of the scope of the Protection of Freedoms Act Part 6 regulations on the right to request data as data (I need to check them again…)?

    * The Home Office did release a table of designated public places in response to an FOI request about designated public place orders, although not as data… But it got me wondering: if I scheduled a monthly FOI request to the Home Office requesting the data on a monthly basis, would they soon stop fulfilling the requests as timewasting? How about if we got a rota going?! Is there any notion of a longitudinal/persistent FOI request, that just keeps on giving (could I request the list of designated public places the Home Office has been informed about over the last year, along with a monthly update of requests in the previous month (or previous month but one, or whatever is reasonable…) over the next 18 months, or two years, or for the life of the regulation, or until such a time as the data is published as open data on a regular basis?

    As for the report to government that a local authority must make on passing a designation order – 9. A copy of any order shall be sent to the Secretary of State as soon as reasonably practicable after it has been made. – it seems that how the area denoted as a public space is described is moot: “5. Before making an order, a local authority shall cause to be published in a newspaper circulating in its area a notice— (a)identifying specifically or by description the place proposed to be identified;“. Hmmm, two things jump out there…

    Firstly, a local authority shall cause to be published in a newspaper circulating in its area [my emphasis; how is a newspaper circulating in its area defined? Do all areas of England have a non-national newspaper circulating in that area? Does this implicitly denote some “official channel” responsibility on local newspapers for the communication of local government notices?]. Hmmm…..

    Secondly, the area identified specifically or by description. On commencement, the order must also be made public by “identifying the place which has been identified in the order”, again “in a newspaper circulating in its area”. But I wonder – is there an opportunity there to require something along the lines of and published using an appropriate open data standard in a open public data repository, and maybe further require that this open public data copy is the one that is used as part of the submission informing the Home Office about the regulation? And if we go overboard, how about we further require that each enacted and proposed order is published as such along with a machine readable geodata description and that a single aggregate files containing all that Local Authority’s currently and planned Designated Public Spaces are also published (so one URL for all current spaces, one for all planned ones). Just by the by, does anyone know of any local councils publishing boundary date/shapefiles that mark out their Designated Public Spaces? Please let me know via the comments, if so…

    A couple of other, very loosely (alcohol) related, things I found along the way:

    • Local Alcohol Profiles for England: the aim appears to have been the collation of, and a way of exploring, a “national alcohol dataset”, that maps alcohol related health indicators on a PCT (Primary Care Trust) and LA (local authority) basis. What this immediately got me wondering was: did they produce any tooling, recipes or infrastructure that would it make a few clicks easy to pull together a national tobacco dataset and associated website, for example? And then I found the Local Tobacco Control Profiles for England toolkit on the London Health Observatory website, along with a load of other public health observatories and it made me remember – again – just how many data sensemaking websites there already are out there…
    • UK Alcohol Strategy – maybe some leads into other datasets/data stories?

    PS I wonder if any of the London Boroughs or councils hosting regional events have recently declared any new Designated Public Spaces #becauseOfTheOlympics.

    Dashboard Views as Data Source Directories: Open Data Communities

    Publishing open data is one thing, reusing it quite another. Firstly, you’re faced with a discovery problem – finding a reliable source of the data you need. Secondly, you need to actually find a way of getting a copy of the data you need into the application or tool you want to use it with. Whilst playing around with the Open Data Communities Local Authority Dashboard, a recently launched user facing view over a wealth of Linked Data published by the Department for Communities and Local Government (DCLG) on the OpenDataCommunities website (New PublishMyData Features: Parameterised and Named Queries), I noticed that they provide a link to the data source for each “fact” on the dashboard:

    One of the ideas I keep returning to is that it should be possible to “View Source” on a chart or data report to see the route back, via a query, to the dataset from whence it came:

    So it’s great to see the Local Authority Dashboard doing just this by exposing the SPARQL query used to return the data from the Open Data Communities datastore:

    You can also run the query to preview its output:

    Conveniently, a permalink is also provided to the query:

    http://opendatacommunities.org/sparql/spend-per-category-per-household?authority=http%3A%2F%2Fopendatacommunities.org%2Fid%2Funitary-authority%2Fisle-of-wight&service_code=490

    This is actually an example of a “Named Query” that the platform provides in the form of a parameterisd ‘shortcut’ URL – changing the authority name and/or service code allows you to use the same base URL pattern to get back finance data in this case relating to other authorities and/or service codes as required.

    The query view is also editable, which means you can use exposed query as a basis for writing your own queries. Once customised, queries can be called programmatcially via a GET request of the form

    http://opendatacommunities.org/sparql.format?query=URL-encoded-SPARQL-query

    Custom queries can also support user defined parameter values by including %{tokens} in the original SPQARQL queries, and providing values for the tokens on the url query string:

    http://opendatacommunities.org/sparql.format?query=URL-encoded-SPARQL-query?token1=value-for-token1&token2=value-for-token2

    As well as previewing the output of a query, we can generate a variety of output formats from a tweak to the URL (add .suffix before the ?), including JSON:

    {
      "head": {
        "vars": [ "spend_per_household" ]
      } ,
      "results": {
        "bindings": [
          {
            "spend_per_household": { "datatype": "http://www.w3.org/2001/XMLSchema#decimal" , "type": "typed-literal" , "value": "115.838709677419354838709677" }
          }
        ]
      }
    }

    XML:

    <?xml version="1.0"?>
    <sparql xmlns="http://www.w3.org/2005/sparql-results#">
      <head>
        <variable name="spend_per_household"/>
      </head>
      <results>
        <result>
          <binding name="spend_per_household">
            <literal datatype="http://www.w3.org/2001/XMLSchema#decimal">115.838709677419354838709677</literal>
          </binding>
        </result>
      </results>
    </sparql>

    and CSV:

    spend_per_household
    115.838709677419354838709677

    Having access to the data in this form means we can then pull it into something like a Google Spreadsheets. For example, we can use the =importData(URL) formual to pull in CSV data from the linked query URL:

    And here’s the result:

    Note: it might be quite handy to be able to suppress the header in the returned CSV so that we could directly use =importData() formula to pull actual values into particular cells, as for example described in Viewing SPARQLed data.gov.uk Data in a Google Spreadsheet and Using Data From Linked Data Datastores the Easy Way (i.e. in a spreadsheet, via a formula). This loss of metadata in the query response is potentially risky, although I would argue the loss of context about what the data relates to is mitigated by seeing the “unpacked” named query (i.e. the SPARQL query it aliases) and the returned data as a system/atom.

    This ability to see the data, then get the data (or “See the data in context – then get the data you need”) is really powerful I think, and offers a way of providing direct access to data via a contextualised view fed from a trusted source.

    Sketching Substantial Council Spending Flows to Serco Using OpenlyLocal Aggregated Spending Data

    An article in today’s Guardian (Serco investigated over claims of ‘unsafe’ out-of-hours GP service) about services provided by Serco to various NHS Trusts got me thinking about how much local councils spend with Serco companies. OpenlyLocal provides a patchy(?) aggregating service over local council spending data (I don’t think there’s an equivalent aggregator for NHS organisations’ spending, or police authority spending?) so I thought I’d have a quick peek at how the money flows from councils to Serco.

    If we search the OpenlyLocal Spending Dashboard, we can get a summary of spend with various Serco companies from local councils whose spending data has ben logged by the site:

    Using the local spend on corporates scraper I used to produce Inter-Council Payments Network Graph, I grabbed details of payments to companies returned by a search on OpenlyLocal for suppliers containing the keyword serco, and then generated a directed graph with edges defined: a) from council nodes to company nodes; b) from company nodes to canonical company nodes. (Where possible, OpenlyLocal tries to reconcile companies identified for payment by councils with canonical company identifiers so that we can start to get a feeling for how different councils make payments to the same companies.)

    I then exported the graph as a json node/edge list so that it could be displayed by Mike Bostock’s d3.js Sankey diagram library:

    (Note that I’ve filtered the edges to only show ones above a certain payment amount (£10k).)

    As a presentation graphic, it’s really tatty, doesn’t include amount labels (though they could be added) and so on. But as a sketch, it provides an easy to digest view over the data as a starting point for a deeper conversation with the data. We might also be able to use the diagram as a starting point for a data quality improvement process, by identifying the companies that we really should try to reconcile.

    Here are flows associated with speend to g4s identified companies:

    I also had a quick peek at which councils were spending £3,500 and up (in total) with the OU…

    Digging into OpenlyLocal spending data a little more deeply, it seems we can get a breakdown of how total payments from council to supplier are made up, such as by spending department.

    Which suggests to me that we could introduce another “column” in the Sankey diagram that joins councils with payees via spending department (I suspect the Category column would result in data that’s a bit too fine grained).

    See also: University Funding – A Wider View

    Inter-Council Payments and the Google Fusion Tables Network Graph

    One of the great things about aggregating local spending data from different councils in the same place – such as on OpenlyLocal – is that you can start to explore structural relations in the way different public bodies of a similar type spend money with each other.

    On the local spend with corporates scraper on Scraperwiki, which I set up to scrape how different councils spent money with particular suppliers, I realised I could also use the scraper to search for how councils spent money with other councils, by searching for suppliers containing phrases such as “district council” or “town council”. (We could also generate views to to see how councils wre spending money with different police authorities, for example.)

    (The OpenlyLocal API doesn’t seem to work with the search, so I scraped the search results HTML pages instead. Results are paged, with 30 results per page, and what seems like a maximum of 1500 (50 pages) of results possible.)

    The publicmesh table on the scraper captures spend going to a range of councils (not parish councils) from other councils. I also uploaded the data to Google Fusion tables (public mesh spending data), and then started to explore it using the new network graph view (via the Experiment menu). So for example, we can get a quick view over how the various county councils make payments to each other:

    Hovering over a node highlights the other nodes its connected to (though it would be good if the text labels from the connected nodes were highlighted and labels for unconnected nodes were greyed out?)

    (I think a Graphviz visualisation would actually be better, eg using Canviz, because it can clearly show edges from A to B as well as B to A…)

    As with many exploratory visualisations, this view helps us identify some more specific questions we might want to ask of the data, rather than presenting a “finished product”.

    As well as the experimental network graph view, I also noticed there’s a new Experimental View for Google Fusion Tables. As well as the normal tabular view, we also get a record view, and (where geo data is identified?) a map view:

    What I’d quite like to see is a merging of map and network graph views…

    One thing I noticed whilst playing with Google Fusion Tables is that getting different aggregate views is rather clunky and relies on column order in the table. So for example, here’s an aggregated view of how different county councils supply other councils:

    In order to aggregate by supplied council, we need to reorder the columns (the aggregate view aggregates columns as thet appear from left to right in the table view). From the Edit column, Modify Table:

    (In my browser, I then had to reload the page for the updated schema to be reflected in the view). Then we can get the count aggregation:

    It would be so much easier if the aggregation view allowed you to order the columns there…

    PS no time to blog this properly right now, but there are a couple of new javascript libraries that are worth mentioning in the datawrangling context.

    In part coming out of the Guardian stable, Misoproject is “an open source toolkit designed to expedite the creation of high-quality interactive storytelling and data visualisation content”. The initial dataset library provides a set of routines for: loading data into the browser from a variety of sources (CSV, Google spreadsheets, JSON), including regular polling; creating and managing data tables and views of those tables within the browser, including column operations such as grouping, statistical operations (min, max, mean, moving average etc); playing nicely with a variety of client side graphics libraries (eg d3.js, Highcharts, Rickshaw and other JQuery graphics plugins).

    Recline.js is a library from Max Ogden and the Open Knowledge Foundation that if its name is anything to go by is positioning itself as an alternative (or complement?) to Google Refine. To my mind though, it’s more akin to a Google Fusion Tables style user interface (“classic” version) wherever you need it, via a Javascript library. The data explorer allows you to import and preview CSV, Excel, Google Spreadsheet and ElasticSearch data from a URL, as well as via file upload (so for example, you can try it with the public spend mesh data CSV from Scraperwiki). Data can be sorted, filtered and viewed by facet, and there’s a set of integrated graphical tools for previewing and displaying data too. Refine.js views can also be shared and embedded, which makes this an ideal tool for data publishers to embed in their sites as a way of facilitating engagement with data on-site, as I expect we’ll see on the Data Hub before too long.

    More reviews of these two libraries later…

    PPS These are also worth a look in respect of generating visualisations based on data stored in Google spreadsheets: DataWrapper and Freedive (like my old Guardian Datastore explorer, but done properly… Wizard led UI that helps you create your own searchable and embeddable database view direct from a Google Spreadsheet).

    Local and Sector Specific Data Verticals

    Although a wealth of public data sets are being made available by government departments and local bodies, it can often be hard to track down. Data.gov.uk maintains an index of a wide variety of publicly released datasets, and more can be found via data released under FOI requests, either made through WhatDoTheyKnow or via a web search of government websites for FOI disclosure logs. But now it seems that interest may be picking up in making data available in more palatable ways…

    Take for example datagenerator, “an online service designed to help individuals and businesses in the creative sector to access the latest industry research and analysis” operated by Creative & Cultural Skills, the sector skills council for the UK’s creative and cultural industries:

    This tool allows you search through – and select – data from a variety of sources and generate a range of tabulated data reports, or visual charts based on the datasets you have selected. It’ll be interesting to see whether or note this promotes uptake/use of the data made available via the service? That is, maybe the first step towards uptake of data at scale (rather than by developers for app development, for example), is the provision of tools that allow the creation of reports and dashboards?

    If the datagenerator approach is successful, I wonder if it would help with uptake of data and research made available via the DCMS CASE programme?

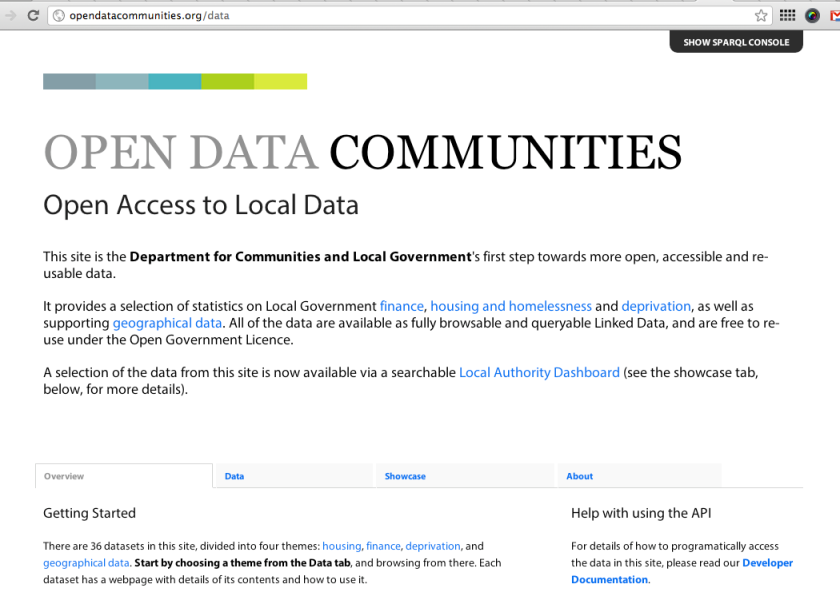
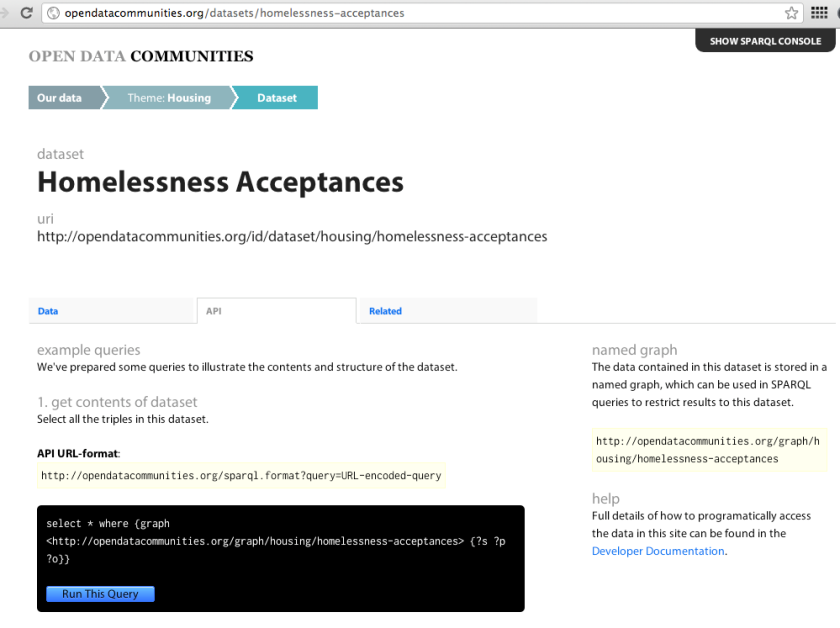
    Or how about OpenDataComminites, which is trying to make Linked Data published via DCLG a little more palatable.

    There’s still a little way to go before this becomes widely used though, I suspect?

    But it’s a good start, and just needs some way of allowing folk to share more useful queries now and maybe hide them under a description of what sorts of result they (are supposed to?!) return.

    Data powered services

    As the recent National Audit Office report on Implementing Transparency reminds us, the UK Government’s transparency agenda is driving the release of public data not only for the purposes of increased accountability and improving services, but also with the intention of unlocking or realising value associated with datasets generated or held by public bodies. In this respect, it is interesting to see how data sets are also being used to power services at a local level, improving service provision for citizens at the same time.

    In Putting Public Open Data to Work…?, I reviewed several data related services built on top of data released at a local level that might also provide the basis for a destination site at a national level based on a aggregation of the locally produced data. Two problems immediately come to mind in this respect. Firstly, identifying where (or indeed, if) the local data can be found; secondly, normalising the data. Even if 10 councils nominally publish the same sort of dataset, it’s likely that the data will be formatted or published in 11 or more different ways!

    (Note that for local government data, one way of tracking down data sets is to use the Local Government Service IDs to identify web pages relating to the service of interest: for example, Aggregated Local Government Verticals Based on LocalGov Service IDs.)

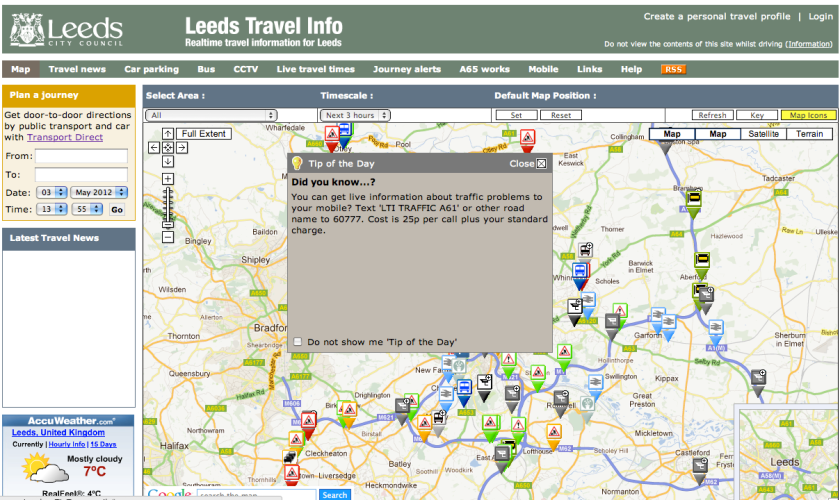
    Here’s a (new to me) example of one such service in the transport domain – Leeds Travel Info

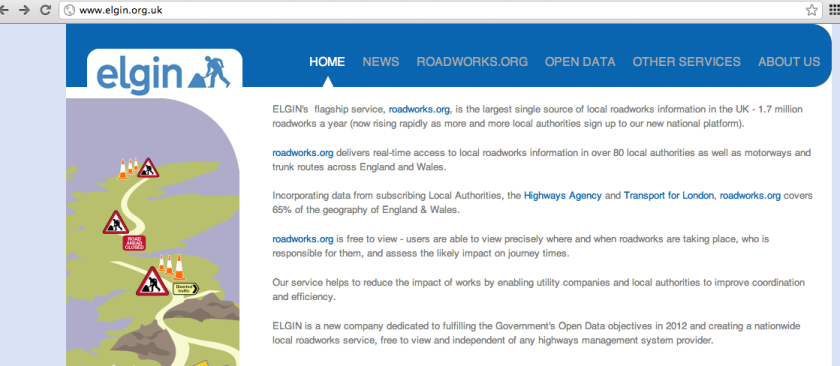
    Another traffic related site shows how it may be possible to build a sustainable, national service on top of aggregated public data, offering benefits back to local councils as well as to members of the public: operated by Elgin, roadworks.org aggregates roadworks related data fom across the UK and makes it avaiable via a user facing site as well as an API.

    The various Elgin articles provide an interesting starting point, I think, for anyone who’s considering building a service that may benefit local government service provision and citizens alike based around open data.

    ELGIN is the trading name of Roadworks Information Limited, a new company established in 2011 to take over the stewardship of roadworks.org (formerly http://www.elgin.gov.uk).
    ELGIN has been established specifically to realize the Government’s vision of opening up local transport data by December 2012 (see Prime Minister’s statement 7th July and the Chancellor’s Autumn statement November 2011.)

    ELGIN is dedicated to preserving the free-to-view national roadworks portal and extending its range of Open Data services throughout the Intelligent Transport and software communities.

    roadworks.org is a free-to-view web based information service which publishes current and planned roadworks fulfilling the requirements of members of the public wanting quick information on roadworks and providing a data rich environment for traffic management professionals and utility companies.

    [ELGIN supports the roadworks.org local roadworks portal by the providing services to local authority and utility clients and through subscriptions from participating local authorities. Though a private company, ELGIN manages roadworks.org and adheres to public sector standards of governance and a commitment to free and open data.]

    Our policies and development strategy are strongly influenced by our Subscribers and governed by a governance regime appropriate to our role serving the public sector.

    We are committed to helping achieve better coordination of roadworks, and in working together with all stakeholders to realise the vision of open, accessible, timely and accurate roadworks information.

    [ELGIN redistributes public sector information under the Open Government Licence and provides its added value aggregation and application services to industry via its easy to use API (Application Programme Interface).]

    Another application I quite like is YourTaximeter, This service scrapes and interprets local regulations in a contextually meaningful way, in this case locally set Hackney Carriage (taxi) fares:

    If you know of any other local data or local legislation powered apps that are out there, please feel free to add a link in the comments, and I’ll maybe do a round up of anything that turns up;-)