So I had another bit of a tinker, and came up with some code that’s breaking all over the place, but I think there’s enough of a vision there to have something to say, so I’ll say it…
How’s about a generic query’n’viz tool for the Guardian datastore? My first (and maybe last) attempt at a back of an envelope, sometimes it works, sometimes it doesn’t, bare bones rapid prototype of just such a thing can be found here.
In my original post on Making it a Little Easier to Use Google Spreadsheets as a Database (Hopefully!), I sketched out a simple form for helping create calls to a Google spreadsheet using the Google visualisation API query language. I then extended this to try to make the query building a little more transparent: Last Night’s Update to the “Google Spreadsheets as a Database” Demo. Today’s step is to see how we can make it easier to pull in spreadsheets from the datastore collection as a whole.
So referring to the image below, if you select a spreadsheet from the drop down list and click preview, you should get a preview of the column headings from that spreadsheet:

(The new link is to an original Guardian blog post announcing or describing the data.)
The list items are pulled in from a tag on my delicious account, which actually bookmarks the original data blog posts. The URI for the spreadsheet is added to the end of the bookmark description, and keyed with a –:

ISSUE 1: Sometimes the spreadsheet doesn’t load… I don’t know if this is down to something I’m (not) doing or not (if you’ve seen this sort of error and know a cause/fix, please post a comment below).
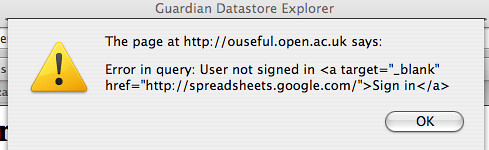
I’ve found if you just keep canceling the alert and clicking “Preview” the file loads in the end…
Scroll down on the page, and you can now start to build a query:

(See Last Night’s Update to the “Google Spreadsheets as a Database” Demo for more on this.)
Another new feature is the ability to preview results using various chart types, rather than just use a data table:
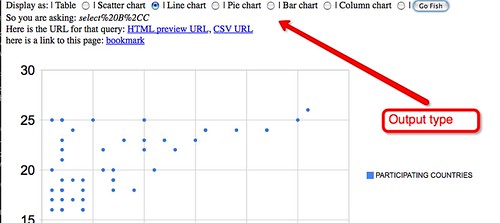
(Oh yes – the “bookmark” link should also allow you to share the current view with other people. At least, it shares the spreadsheet ID and the query, but not the view type…)
I haven’t implemented chart labeling, or the ability to set what values are used for what bit of the chart, so chart compomnent default rules apply. By juggling the queries (including changing the order of columns that appear in the various text boxes), you can sometimes get a reasonable chart out.
Of course, you can always just grab the CSV URL and then visualise the data in something like Many Eyes Wikified.
The chart components I used are all taken from the Google Visualisation API, so they play nicely with the Google data source representation that holds the data values.
So, that’s where it’s at, and that’s probably me done with it now… (I think I can see what’s possible so my fun is done…) And if you haven’t got an inkling of what it is I think I can see, it’s this:
A front end to the Guardian data store that lets readers:
– select a data set from the datastore (and maybe get a chance to view the original story from the datablog; I guess this could be pulled in from the Guardian OpenPlatform API?)
– write queries on that dataset to generate particular views of the data;
– generate CSV and HTML preview view URLs for a particular query, so the data can be shared with other people (turning different views on subsets of the data into social objects);
– generate quick visualisation previews of different views of the data.Nice to haves? Maybe links to stories that also mention the data, again via the OpenPlatform API? A collection of different bookmarks/views that use the same spreadsheet, so readers can share their own views of the data (the sort of social thing that Many Eyes Wikified offers). An opportunity to accept comments on a dataset? etc etc
All told, I reckon it’s taken less than 20 hours of solo effort (except for a bit of 3rd party bug spotting ;-), plus time to write the blog posts, to get this far (but the state of the code shows that: it’s truly scrappy). A fair amount of that time was spent learning how to do stuff and looking at exemplar code on Google AJAX APIs Code Playground. Of course, there are bugs’n’issues all over the place, but as people bring them to my attention, I tend to see if there’s a quick fix…
PS (I think) I’ve just noticed a Google data source wrapper for Pachube (Google Visualization API for Pachube history), which means that as well as pulling in Guardian datastore content from Google spreadsheets (as well as other publishers’ content on Google spreadsheets), this ‘interface’ could also be applied to Pachube data. (If you know of anyone else who exposes the Google visualisation/data source API, please post a link below.)
PPS search key: I also call this the Guardian Datastore Explorer…

great stuff! i’ve been using many eyes so far, but their buggy login mechanism + cumbersome java applets pushed me towards the google visualisation api. would be great to have this integration as an open source project, i’m sure others will be happy to contribute code to it.