Grouping Numbers that are Nearly the Same – Casual Clustering

A couple of reasons for tinkering with WRC rally data this year, over and the above the obvious of wanting to find a way to engage with motorsport at a data level, specifically, I wanted a context for thinking a bit more about ways of generating (commentary) text from timing data, as well as a “safe” environment in which I could look for ways of identifying features (or storypoints) in the data that might provide a basis for making interesting text comments.

One way in to finding features is to look at a visual representations of the data (that is, just look at charts) and see what jumps out… If anything does, then you can ponder ways of automating the detection or recognition of those visually compelling features, or things that correspond to them, or proxy for them, in some way. I’ll give an example of that in the next post in this series, but for now, let’s consider the following question:how can we group numbers that are nearly the same? For example, if I have a set of stage split times, how can I identify groups of drivers that have recorded exactly, or even just nearly, the same time?

Via StackOverflow, I found the following handy fragment:

def cluster(data, maxgap):
    '''Arrange data into groups where successive elements
       differ by no more than *maxgap*

        cluster([1, 6, 9, 100, 102, 105, 109, 134, 139], maxgap=10)
        [[1, 6, 9], [100, 102, 105, 109], [134, 139]]

        cluster([1, 6, 9, 99, 100, 102, 105, 134, 139, 141], maxgap=10)
        [[1, 6, 9], [99, 100, 102, 105], [134, 139, 141]]

    '''
    data.sort()
    groups = [[data[0]]]
    for x in data[1:]:
        if abs(x - groups[-1][-1]) <= maxgap:
            groups[-1].append(x)
        else:
            groups.append([x])
    return groups

print(cluster([2.1,7.4,3.9,4.6,2.5,2.4,2.52],0.35))
[[2.1, 2.4, 2.5, 2.52], [3.9], [4.6], [7.4]]

It struck me that a tweak to the code could limit the range of any grouping relative to a maximum distance between the first and the last number in any particular grouping – maybe I don’t want a group to have a range more than 0.41 for example (that is, strictly more than a dodgy floating point 0.4…):

def cluster2(data, maxgap, maxrange=None):
    data.sort()
    groups = [[data[0]]]
    for x in data[1:]:
        inmaxrange = True if maxrange is None else abs(x-groups[-1][0]) <=maxrange
        if abs(x - groups[-1][-1]) <= maxgap and inmaxrange:
            groups[-1].append(x)
            groups[-1].append(x)
        else:
            groups.append([x])
    return groups

print(cluster2([2.1,7.4,3.9,4.6,2.5,2.4,2.52],0.35,0.41))
[[2.1, 2.4, 2.5], [2.52], [3.9], [4.6], [7.4]]

A downside of this is we might argue we have mistakenly omitted a number that is very close to the last number in the previous group, when we should rightfully have included it, because it’s not really very far away from a number that is close to the group range threshold value…

In which case, we might pull back numbers into a group that are really close to the current last member in the group irrespective of whether we past the originally specified group range:

def cluster3(data, maxgap, maxrange=None, maxminrange=None):
    data.sort()
    groups = [[data[0]]]
    for x in data[1:]:
        inmaxrange = True if maxrange is None else abs(x-groups[-1][0])<=maxrange
        inmaxminrange = False if maxminrange is None else abs(x-groups[-1][-1])<=maxminrange
        if (abs(x - groups[-1][-1]) <= maxgap and inmaxrange) or inmaxminrange:
            groups[-1].append(x)
        else:
            groups.append([x])
    return groups

print(cluster3([2.1,7.4,3.9,4.6,2.5,2.4,2.52],0.35,0.41,0.25))
[[2.1, 2.4, 2.5, 2.52], [3.9], [4.6], [7.4]]

With these simple fragments, I can now find groups of times that are reasonably close to each other.

I can also look for times that are close to other times:

trythis = [x for x in cluster3([2.1,7.4,3.9,4.6,2.5,2.4,2.52],0.35,0.41,0.25) if 2.4 in x]
trythis[0] if len(trythis) else ''
[2.1, 2.4, 2.5, 2.52]

PS I think the following vectorised pandas fragments assign group numbers to rows based on the near matches of numerics in a specified column:

def numclustergroup(x,col,maxgap):
    x=x.sort_values(col)
    x['cluster'] = (x[col].diff()>=maxgap).cumsum()
    return x

def numclustergroup2(x,col,maxgap,maxrange):
    x=x.sort_values(col)
    x['cluster'] = (x[col].diff()>=maxgap).cumsum()
    x['cdiff']=x.groupby('cluster')[col].diff()
    x['cluster'] = ((x.groupby('cluster')['cdiff'].cumsum()>maxrange) | (x[col].diff()>=maxgap)).cumsum()
    return x.drop('cdiff',1)

def numclustergroup3(x,col,maxgap,maxrange,maxminrange):
    x=x.sort_values(col)
    x['cluster'] = (x[col].diff()>=maxgap).cumsum()
    x['cdiff']=x.groupby('cluster')[col].diff()
    x['cluster'] = (((x.groupby('cluster')['cdiff'].cumsum()>maxrange) | (x[col].diff()>=maxgap)) & (x[col].diff()>maxminrange) ).cumsum()
    return x.drop('cdiff',1)

#Test
uu=pd.DataFrame({'x':list(range(0,8)),'y':[1.3,2.1,7.4,3.9,4.6,2.5,2.4,2.52]})
numclustergroup(uu,'y',0.35)
numclustergroup2(uu,'y',0.35,0.41)
numclustergroup3(uu,'y',0.35,0.41,0.25)

The basic idea is to generate logical tests that evaluate as True whenever you want to increase the group number.

What Nationality Did You Say You Were, Again?

For the first time in way too long, I went to a data dive over the weekend, facilitated by DataKind on behalf of Global Witness, for a couple of days messing around with the UK Companies House  Significant Control (“beneficial ownership”) register.

One of the data fields in the data set is the nationality of a company’s controlling entity, where that’s a person rather than a company. The field is a free text one, which means that folk completing a return have to write their own answer in to the box, rather than selecting from a specified list.

The following are the more popular nationalities, as declared…

country_match

Note that “English” doesn’t count – for the moment, the nationality should be declared as “British”…

And some less popular ones  – as well as typos…:

country_match2

So how can we start to clean this data?

One the libraries I discovered over the weekend was fuzzyset, that lets you add “target” strings to a set and then do a fuzzy match retrieval from the set using a word or phrase you have been provided with.

If we find a list of recognised nationalities, we could add these to a canonical “nationality” set, and then try to match supplied nationalities against them.

The UK Foreign & Commonwealth Office register of country names, a register that lists formalised country names for use in government, also includes nationalities – so maybe we can use that?

Adding the FCO nationalities to a  fuzzyset list, and then matching nationalities from the significant control register against those nationalities, gives a glimpse into the cleanliness (or otherwise!) of the data. For example, here’s what was matched against “British”:

British | Britsh | Bristish | Brisith | Scottish | Britsih | British/Greek | Greek/British | Briitish | British/Czech | Bitish | Brtisih | British/Welsh | Brirish | Brtish | British. | British Norfolk | British Cornish | British Subject | British English | Uk British | British/Irish | Britiah | British/Swedish | Biitish | Brititsh | British/English | Briish | British/Persian | Britiish | Brittish | French British | British/German | British/Syrian | Britihs | Briitsh | British /English | British / English | Brits | Kenyan/British | Britis | American British | Btitish | British/Bahrain Dual | Brtitish | Polish/British | Dual British/Irish | Brirtish | British- | British Uk | Brutish | Britich | British (Naturalised) | British (Canada Born) | Brithish | British Irish | British & Usa | Britisch | British/French | British/Israeli | Britrish | Britsh - English | American/British | Britisb | White British | Birtish | English / British | British/Turkish | Dual Usa/British | British/Swiss | Biritish | Britishu | Britisah | European British | British / Scottish | British & Israeli | British Swiss | Scotish | British Welsh | Britisn | Briti | Britihs & Irish | Britishi | Brfitish | Usa And British | American / British | British-United Kingdom | British Usa | Britisg | Israeli/British | Britih | Welsh British | Us & British | British Indian | British Asian | B Ritish | Emaratis | British/Bosnian | White Brtitish | British - English | Welsh/British | German/British | British & Irish | British-Israeli | British / Greek | Great British | Beitish | White Uk British | Belizean & British | Brithish English | Brituish | Britiash | Indian British | British Caribbean | Swedish/British | Britisjh | British Amercian | Britisk | Turkish/British | Brtiish | Br5itish | Brritish | Welsh, British | Brtitsh | U.K British | Britidh | Kurdish/British | English British | Brith | Irish/British | Britisj | British/Pakistan | I'M British | Britisih | American & British | British / Welsh | British / Swiss | Brittsh | British Icelandic | Swiss / British | Brotish | British Sikh | English/British | Britiswh | Bristsh | British European | British And Usa | British / Israeli | British Bengali | British Afghan | Brithsh | Brit6ish | British/Indian | British/Libyan | British/Polish | British Israeli | British National | Swiss British | Briritsh | Britishh | British / Irish | Brithis | Britshi | British And Thai | Britush | Britiss | British, English | Bfritish | Btritish | Brisitsh | White English | British/Mosotho | Usa & British | British/ Eu National | Finnish/British | Israeli + British | British And Polish | Bartish | Nritish | Brishish | British Manx | German And British | Britiosh | British (Bermudian) | Britishbritish | Naturalised British | English - British | Welsh - British | Dual American/British | British,Uk | British And Us | Uk Brittish | British Overseas | British & Swiss | English-British | British & Polish | Us/British | Swiss & British | British And Greek | Iraqi, British | Breitish | Black British | U.K. British | Afghan British | Brit / English | British/Asian | Awhite British | Asian British | British / Polish | Caucasian British | Britosh | Bristih | Britsish | British Libyan | Britisth | Brisish | British & Spanish | Britinsh | Britisht | Britsith | Britash | Irish / British | Brisitish | Brirtsh | Bruitish | Dutch / British | Bristis | Ritish | Welsh, Bristish | British Resident | British And French | British/ English | British (Welsh) | French/British | Dual British - French | Bristiah | Great Britain & Usa | British & Us | Uk Scottish | British Scott | Brititish | Dual: British, Usa | .British | British (Scots) | Scottish Uk | British/Scottish | Brittiish | British-Irish | Btittish | Scottish. | Britisy | Bruttish | Dual British Irish | Scottish/British

In passing, English matched best with Bangladeshi, so we maybe need to tweak the lookup somewhere, perhaps adding English, Scottish, Northern Irish, Welsh, and maybe the names of UK counties, into the fuzzyset, and then in post-processing mapping from these to British?

Also by the by, word had it that Companies House didn’t consider there to be any likely significant data quality issues with this field… so that’s alright then….

PS For various fragments of code I used to have a quick look at the nationality data, see this gist. If you look through the fuzzy matchings to the FCO nationalities, you’ll see there are quite a few false attributions. It would be sensible to look at the confidence ratings on the matches, and perhaps set thresholds for automatically allocating submitted nationalities to canonical nationalities. In a learning system, it may be possible to bootstrap – add high confidence mappings to the fuzzyset (with a map to the canonical nationality) and then try to match again the nationalities still unmatched at a particular level of confidence?


Sorry, something went wrong. Reload?
Sorry, we cannot display this file.
Sorry, this file is invalid so it cannot be displayed.

Accounting for Inflation – Deflators, or “What Does ‘Prices in Real Terms’ Actually Mean?”

“How much would £85.32 million in 2011-12 prices have been worth in 2007-08?” We see this sort of statement in the news all the time, either in reports about the effects of inflation, or as a way of making historical comparisons, so there must be a simple way of calculating the result.

The answer, it seems, comes in the form of “GDP Deflators“, tables of which are published quarterly (for example, see the UK’s GDP deflators at market prices, and money GDP: June 2014 (Quarterly National Accounts)).

The gov.uk published document How to use the GDP deflator series: Practical examples.

Deflation tables have the following form:

deflator_table

Several examples of common calculations are shown:

deflator_example1

deflator_example2

deflator_example3

The House of Commons Library also publishes a Statistical Literacy Guide – How to adjust for inflation with a little more detail. It also qualifies the meaning of “prices in real terms” as constant prices, that is, prices where inflation has been taken into account (deflated).

The corollary of rising prices is a fall in the value of money, and expressing currency in real terms simply takes account of this fact. £100 in 1959 is nominally the same as £100 in 2009, but in real terms the [nominal] £100 in 1959 is worth more because of the inflation over this period. Of course, if inflation is zero, then nominal and real amounts are the same.

Often we want to express a series of actual (nominal) values in real terms. This involves revaluing every annual figure into a chosen year’s prices (a base year), effectively repeating the stages above on a series of nominal values and using the same base year (year x above) for all. … Once done, changes can be calculated in percentage or absolute terms. The choice of base year does not affect percentage change calculations, but it will affect the absolute change figure, so it is important to specify the base year.

The Commons Library Standard Note also clarifies that the idea that the process of inflating figures relates to the notion of purchasing power – for example, what would a pound in 2005 be worth today?

purchasing power

So what other “everyday economics” terms are there that I don’t really understand? “Seasonal adjustment” and “seasonally adjusted figures” for one.. But that will have to be the subject of a further post.

PS for deflators for other countries, the OECD aggregates a few: GeoBook: Deflators.

PPS see also @mcgettigan on Student loan repayments & ‘present value’ (h/t Joss Winn). Are there standard calculations that consider if you make actual (at the time) payments of £x_m per month, m, eg grabbed from your bank statements, and then sum the “real terms” values of those according to some baseline? Would that sort of calculation even make sense?

Opening Up Access to Data: Why APIs May Not Be Enough…

Last week, a post on the ONS (Office of National Statistics) Digital Publishing blog caught my eye: Introducing the New Improved ONS API which apparently “mak[es] things much easier to work with”.

Ooh… exciting…. maybe I can use this to start hacking together some notebooks?:-)

It was followed a few days later by this one – ONS-API, Just the Numbers which described “a simple bit of code for requesting some data and then turning that into ‘just the raw numbers’” – a blog post that describes how to get a simple statistic, as a number, from the API. The API that “mak[es] things much easier to work with”.

After a few hours spent hacking away over the weekend, looking round various bits of the API, I still wasn’t really in a position to discover where to find the numbers, let alone get numbers out of the API in a reliable way. (You can see my fumblings here.) Note that I’m happy to be told I’m going about this completely the wrong way and didn’t find the baby steps guide I need to help me use it properly.

So FWIW, here are some reflections, from a personal standpoint, about the whole API thing from the perspective of someone who couldn’t get it together enough to get the thing working …


Most data users aren’t programmers. And I’m not sure how many programmers are data junkies, let alone statisticians and data analysts.

For data users who do dabble with programming – in R, for example, or python (for example, using the pandas library) – the offer of an API is often seen as providing a way of interrogating a data source and getting the bits of data you want. The alternative to this is often having to download a huge great dataset yourself and then querying it or partitioning it yourself to get just the data elements you want to make use of (for example, Working With Large Text Files – Finding UK Companies by Postcode or Business Area).

That’s fine, insofar as it goes, but it starts to give the person who wants to do some data analysis a data management problem too. And for data users who aren’t happy working with gigabyte data files, it can sometimes be a blocker. (Big file downloads also take time, and incur bandwidth costs.)

For me, a stereotypical data user might be someone who typically wants to be able to quickly and easily get just the data they want from the API into a data representation that is native to the environment they are working in, and that they are familiar with working with.

This might be a spreadsheet user or it might be a code (R, pandas etc) user.

In the same way that spreadsheet users want files in XLS or CSV format that they can easily open, (formats that can be also be directly opened into appropriate data structures in R or pandas), I increasingly look not for APIs, but for API wrappers, that bring API calls and the results from them directly into the environment I’m working in in a form appropriate to that environment.

So for example, in R, I make use of the FAOstat package, which also offers an interface to the World Bank Indicators datasets. In pandas, a remote data access handler for the World Bank Indicators portal allows me to make simple requests for that data.

At a level up (or should that be “down”?) from the API wrapper are libraries that parse typical response formats. For example, Statistics Norway seem to publish data using the json-stat format, the format used in the new ONS API update. This IPython notebook shows how to use the pyjstat python package to parse the json-stat data directly into a pandas dataframe (I couldn’t get it to work with the ONS data feed – not sure if the problem was me, the package, or the data feed; which is another problem – working out where the problem is…). For parsing data returned from SPARQL Linked Data endpoints, packages such as SPARQLwrapper get the data into Python dicts, if not pandas dataframes directly. (A SPARQL i/o wrapper for pandas could be quite handy?)

At the user level, IPython Notebooks (my current ‘can be used to solve all known problems’ piece of magic tech!;-) provide a great way of demonstrating not just how to get started with an API, but also encourage the development within the notebook or reusable components, as well as demonstrations of how to use the data. The latter demonstrations have the benefit of requiring that the API demo does actually get the data into a form that is useable within the environment. It also helps folk see what it means to be able to get data into the environment (it means you can do things like the things done in the demo…; and if you can do that, then you can probably also do other related things…)

So am I happy when I see APIs announced? Yes and no… I’m more interested in having API wrappers available within my data wrangling environment. If that’s a fully blown wrapper, great. If that sort of wrapper isn’t available, but I can use a standard data feed parsing library to parse results pulled from easily generated RESTful URLs, I can just about work out how to create the URLs, so that’s not too bad either.

When publishing APIs, it’s worth considering who can address them and use them. Just because you publish a data API doesn’t mean a data analyst can necessarily use the data, because they may not be (are likely not to be) a programmer. And if ten, or a hundred, or a thousand potential data users all have to implement the same sort of glue code to get the data from the API into the same sort of analysis environment, that’s not necessarily efficient either. (Data users may feel they can hack some code to get the data from the API into the environment for their particular use case, but may not be willing to release it as a general, tested and robust API wrapper, certainly not a stable production level one.)

This isn’t meant to be a slight against the ONS API, more a reflection on some of the things I was thinking as I hacked my weekend away…

PS I don’t know how easy it is to run Python code in R, but the R magic in IPython notebooks supports the running of R code within a notebook running a Python kernel, with the handing over of data from R dataframes to python dataframes. Which is to say, if there’s an R package available, for someone who can run R via an IPython context, it’s available via python too.

PPS I notice that from some of the ONS API calls we can get links to URLs of downloadable datasets (though when I tried some of them, I got errors trying to unzip the results). This provides an intermediate way of providing API access to a dataset – search based API calls that allow discovery of a dataset, then the download and automatic unpacking of that dataset into a native data representation, such as one or more data frames.

A Conversation With Data – Isle of Wight Car Parking Meter Transaction Logs

Killer post title, eh?

Some time ago I put in an FOI request to the Isle of Wight Council for the transaction logs from a couple of ticket machines in the car park at Yarmouth. Since then, the Council made some unpopular decisions about car parking charges, got a recall and then in passing made the local BBC news (along with other councils) in respect of the extent of parking charge overpayments…

Here’s how hyperlocal news outlet OnTheWight reported the unfolding story…

I really missed a trick not getting involved in this process – because there is, or could be, a significant data element to it. And I had a sample of data that I could have doodled with, and then gone for the whole data set.

Anyway, I finally made a start on looking at the data I did have with a view to seeing what stories or insight we might be able to pull from it – the first sketch of my conversation with the data is here: A Conversation With Data – Car Parking Meter Data.

It’s not just the parking meter data that can be brought to bear in this case – there’s another set of relevant data too, and I also had a sample of that: traffic penalty charge notices (i.e. traffic warden ticket issuances…)

With a bit of luck, I’ll have a go at a quick conversation with that data over the next week or so… Then maybe put in a full set of FOI requests for data from all the Council operated ticket machines, and all the penalty notices issued, for a couple of financial years.

Several things I think might be interesting to look at Island-wide:

  • in much the same was as Tube platforms suffer from loading problems, where folk surge around one entrance or another, do car parks “fill up” in some sort of order, eg within a car park (one meter lags the other in terms of tickets issued) or one car park lags another overall;
  • do different car parks have a different balance of ticket types issued (are some used for long stay, others for short stay?) and does this change according to what day of the week it is?
  • how does the issuance of traffic penalty charge notices compare with the sorts of parking meter tickets issued?
  • from the timestamps of when traffic penalty charge notices tickets are issued, can we work out the rounds of different traffic warden patrols?

The last one might be a little bit cheeky – just like you aren’t supposed to share information about the mobile speed traps, perhaps you also aren’t supposed to share information that there’s a traffic warden doing the rounds…?!

Recreational Data: Data Golf

I’m still hopeful of working up the idea of recreational data as a popular pastime activity with a regular column somewhere and a stocking filler book each Christmas (?!;-), but haven’t had much time to commit to working up some great examples lately:-(

However, here’s a neat idea – data golf – as described in a post by Bogumił Kamiński (RGolf) that I found via RBloggers:

There are many code golf sites, even some support R. However, most of them are algorithm oriented. A true RGolf competition should involve transforming a source data frame to some target format data frame.

So the challenge today will be to write a shortest code in R that performs a required data transformation

An example is then given of a data reshaping/transformation problem based on a real data task (wrangling survey data, converting it from a long to a wide format in the smallest amount of R.

Of course, R need not be the only language that can be used to play this game. For the course I’m currently writing, I think I’ll pitch data golf as a Python/pandas activity in the section on data shaping. OpenRefine also supports a certain number of reshaping transformations, so that’s another possible data golf course(?). As are spreadsheets. And so on…

Hmmm… thinks… pivot table golf?

Also related: string parsing/transformation or partial string extraction using regular expressions; for example, Regex Tuesday, or how about Regex Crossword.

care.data Redux

In a comment based conversation with Anne-Marie Cunningham/@amcunningham last night, it seems I’d made a few errors in the post Demographically Classed, mistakenly attributing the use of HES data by actuaries in the Extending the Critical Path report to the SIAS when it should have been a working group of (I think?!) the Institute and Faculty of Actuaries (IFoA). I’d also messed up in assuming that the HES data was annotated with ACORN and MOSAIC data by the researchers, a mistaken assumption that begged the question as to how that linkage was actually done. Anne-Marie did the journalistic thing and called the press office (seems not many hacks did…) and discovered that “The researchers did not do any data linkage. This was all done by NHSIC. They did receive it fully coded. They only received 1st half of postcode and age group. There was no information on which hospitals people had attended.” Thanks, Anne-Marie:-)

Note – that last point could be interesting: it would suggest that in the analysis the health effects were decoupled from the facility where folk were treated?

Here are a few further quick notes adding to the previous post:

– the data that will be shared by GPs will be in coded form. An example of the coding scheme is provided in this post on the A Better NHS blog – Care dot data. The actual coding scheme can be found in this spreadsheet from the HSCIC: Code set – specification for the data to be extracted from GP electronic records and described in Care Episode Statistics: Technical Specification of the GP Extract. The tech spec uses the following diagram to explain the process (p19):

HES care.data process

I’m intrigued as to what they man by the ‘non-relational database’…?

As far as the IFoA report goes, an annotated version of this diagram to show how the geodemographic data from Experian and CACI was added, and then how personally identifiable data was stripped before the dataset was handed over to the IFoA ,would have been a useful contribution to the methodology section. I think over the next year or two, folk are going to have to spend some time being clear about the methodology in terms of “transparency” around ethics, anonymisation, privacy etc, whilst the governance issues get clarified and baked into workaday processes and practice.

Getting a more detailed idea of what data will flow and how filters may actually work under various opt-out regimes around various data sharing pathways requires a little more detail. The Falkland Surgery in Newbury provides a useful summary of what data in general GP practices share, including care.data sharing. The site also usefully provides a map of the control-codes that preclude various sharing principles (As simple as I [original site publisher] can make it!):

datasharing control

Returning the to care episode statistics reporting structure, the architecture to support reuse is depicted on p21 of the tech spec as follows:

care data reuse

There also appear to be two main summary pages of resources relating to care data that may be worth exploring further as a starting point: Care.data and Technology, systems and data – Data and information. Further resources are available more generally on Information governance (NHS England).

As I mentioned in my previous post on this topic, I’m not so concerned about personal privacy/personal data leakage as I am about trying to think trough the possible consequences of making bulk data releases available that can be used as the basis for N=All/large scale data modelling (which can suffer from dangerous (non)sampling errors/bias when folk start to opt-out), the results of which are then used to influence the development of and then algorithmic implementation of, policy. This issue is touched on in by blogger and IT, Intellectual Property and Media Law lecturer at the University of East Anglia Law School, Paul Bernal, in his post Care.data and the community…:

The second factor here, and one that seems to be missed (either deliberately or through naïveté) is the number of other, less obvious and potentially far less desirable uses that this kind of data can be put to. Things like raising insurance premiums or health-care costs for those with particular conditions, as demonstrated by the most recent story, are potentially deeply damaging – but they are only the start of the possibilities. Health data can also be used to establish credit ratings, by potential employers, and other related areas – and without any transparency or hope of appeal, as such things may well be calculated by algorithm, with the algorithms protected as trade secrets, and the decisions made automatically. For some particularly vulnerable groups this could be absolutely critical – people with HIV, for example, who might face all kinds of discrimination. Or, to pick a seemingly less extreme and far more numerous group, people with mental health issues. Algorithms could be set up to find anyone with any kind of history of mental health issues – prescriptions for anti-depressants, for example – and filter them out of job applicants, seeing them as potential ‘trouble’. Discriminatory? Absolutely. Illegal? Absolutely. Impossible? Absolutely not – and the experience over recent years of the use of black-lists for people connected with union activity (see for example here) shows that unscrupulous employers might well not just use but encourage the kind of filtering that would ensure that anyone seen as ‘risky’ was avoided. In a climate where there are many more applicants than places for any job, discovering that you have been discriminated against is very, very hard.

This last part is a larger privacy issue – health data is just a part of the equation, and can be added to an already potent mix of data, from the self-profiling of social networks like Facebook to the behavioural targeting of the advertising industry to search-history analytics from Google. Why, then, does care.data matter, if all the rest of it is ‘out there’? Partly because it can confirm and enrich the data gathered in other ways – as the Telegraph story seems to confirm – and partly because it makes it easy for the profilers, and that’s something we really should avoid. They already have too much power over people – we should be reducing that power, not adding to it. [my emphasis]

There are many trivial reasons why large datasets can become biased (for example, see The Hidden Biases in Big Data), but there are also deeper reasons why wee need to start paying more attention to “big” data models and the algorithms that are derived from and applied to them (for example, It’s Not Privacy, and It’s Not Fair [Cynthia Dwork & Deirdre K. Mulligan] and Big Data, Predictive Algorithms and the Virtues of Transparency (Part One) [John Danaher]).

The combined HES’n’insurance report, and the care.data debacle provides an opportunity to start to discuss some of these issues around the use of data, the ways in which data can be combined, the undoubted rise in data brokerage services. So for example, a quick pop over to CCR Dataand they’ll do some data enhancement for you (“We have access to the most accurate and validated sources of information, ensuring the best results for you. There are a host of variables available which provide effective business intelligence [including] [t]elephone number appending, [d]ate of [b]irth, MOSAIC”), [e]nhance your database with email addresses using our email append data enrichment service or wealth profiling. Lovely…

Demographically Classed

So it seems that in a cost-recovered data release that was probably lawful then but possibly wouldn’t be now* – Hospital records of all NHS patients sold to insurers – the Staple Inn Actuarial Society Critical Illness Definitions and Geographical Variations Working Party (of what, I’m not sure? The Institute and Faculty of Actuaries, perhaps?) got some Hospital Episode Statistics data from the precursor to the HSCIC, blended it with some geodemographic data**, and then came to the conclusion that “that the use of geodemographic profiling could refine Critical illness pricing bases” (source: Extending the Critical Path), presenting the report to the Staple Inn Actuarial Society who also headline branded the PDF version of the report? Maybe?

* House of Commons Health Committee, 25/2/14: 15.59:32 for a few minutes or so; that data release would not be approved now: 16.01:15 reiterated at 16.03:05 and 16.07:05

** or maybe they didn’t? Maybe the data came pre-blended, as @amcunningham suggests in the comments? I’ve added a couple of further questions into my comment reply… – UPDATE: “HES was linked to CACI and Experian data by the Information Centre using full postcode. The working party did not receive any identifiable data.”

CLARIFICATION ADDED (source )—-

“In a story published by the Daily Telegraph today research by the IFoA was represented as “NHS data sold to insurers”. This is not the case. The research referenced in this story considered critical illness in the UK and was presented to members of the Staple Inn Actuarial Society (SIAS) in December 2013 and was made publically available on our website.

“The IFoA is a not for profit professional body. The research paper – Extending the Critical Path – offered actuaries, working in critical illness pricing, information that would help them to ask the right questions of their own data. The aim of providing context in this way is to help improve the accuracy of pricing. Accurate pricing is considered fairer by many consumers and leads to better reserving by insurance companies.

There was also an event on 17 February 2014.

Via a tweet from @SIAScommittee, since deleted for some reason(?), this is clarified further: “SIAS did not produce the research/report.”

rebuttal2

The branding that mislead me – I must not be so careless in future…

misleadingBranding

——
Many of the current agreements about possible invasions of privacy arising from the planned care.data release relate to the possible reidentification of individuals from their supposedly anonymised or pseudonymised health data (on my to read list: NHS England – Privacy Impact Assessment: care.data) but to my mind the SIAS report presented to the SIAS suggests that we also need to think about consequences of the ways in which aggregated data is analysed and used (for example, in the construction of predictive models). Where aggregate and summarised data is used as the basis of algorithmic decision making, we need to be mindful that sampling errors, as well as other modelling assumptions, may lead to biases in the algorithms that result. Where algorithmic decisions are applied to people placed into statistical sampling “bins” or categories, errors in the assignment of individuals into a particular bin may result in decisions being made against them on an incorrect basis.

Rather than focussing always on the ‘can I personally be identified from the supposedly anonymised or pseudonymised data’, we also need to be mindful of the extent to, and ways in, which:

1) aggregate and summary data is used to produce models about the behaviour of particular groups;
2) individuals are assigned to groups;
3) attributes identified as a result of statistical modelling of groups are assigned to individuals who are (incorrectly) assigned to particular groups, for example on the basis of estimated geodemographic binning.

What worries me is not so much ‘can I be identified from the data’, but ‘are there data attributes about me that bin me in a particular way that statistical models developed around those bins are used to make decisions about me’. (Related to this are notions of algorithmic transparency – though in many cases I think this must surely go hand in hand with ‘binning transparency’!)

That said, for the personal-reidentification-privacy-lobbiests, they may want to pick up on the claim in the SIASIFoA report (page 19) that:

In theory, there should be a one to one correspondence between individual patients and HESID. The HESID is derived using a matching algorithm mainly mapped to NHS number, but not all records contain an NHS number, especially in the early years, so full matching is not possible. In those cases HES use other patient identifiable fields (Date of Birth, Sex, Postcode, etc.) so imperfect matching may mean patients have more than one HESID. According to the NHS IC 83% of records had an NHS number in 2000/01 and this had grown to 97% by 2007/08, so the issue is clearly reducing. Indeed, our data contains 47.5m unique HESIDs which when compared to the English population of around 49m in 1997, and allowing for approximately 1m new lives a year due to births and inwards migration would suggest around 75% of people in England were admitted at least once during the 13 year period for which we have data. Our view is that this proportion seems a little high but we have been unable to verify that this proportion is reasonable against an independent source.

Given two or three data points, if this near 1-1 correspondence exists, you could possibly start guessing at matching HESIDs to individuals, or family units, quite quickly…

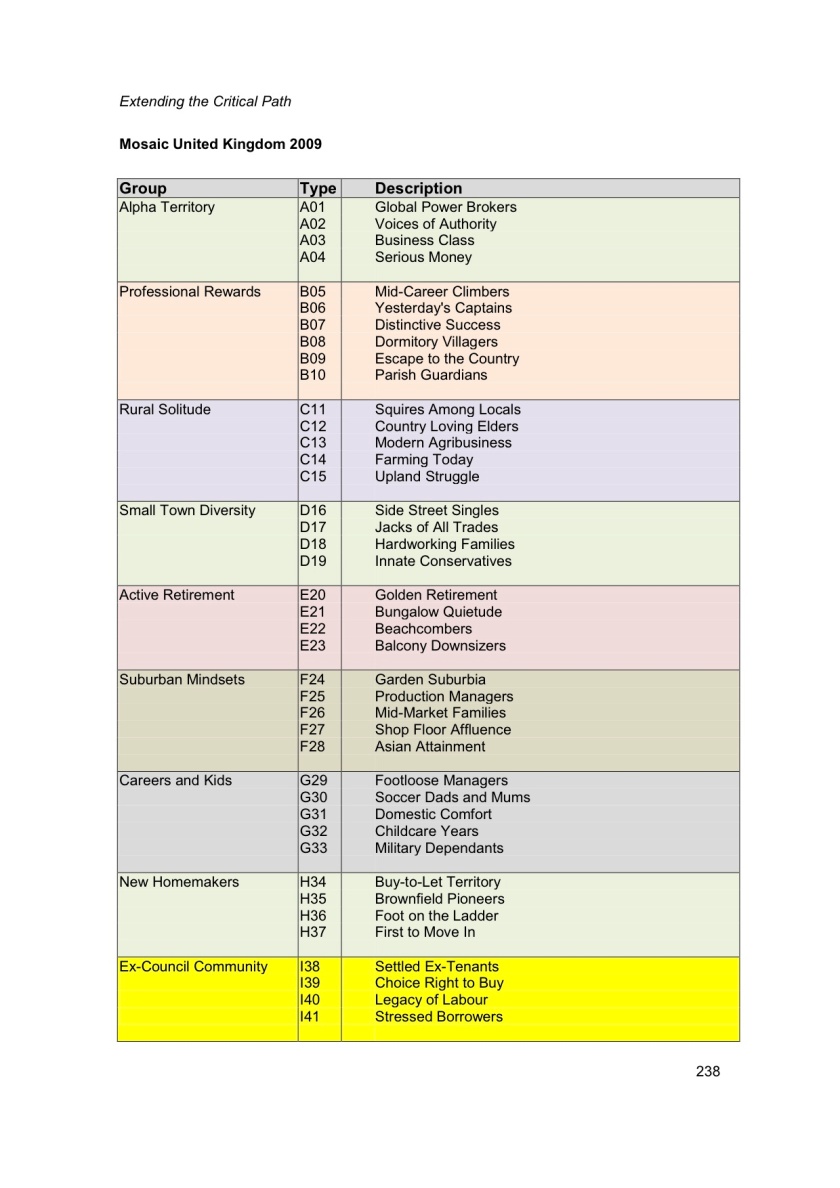
To ground the binning idea slightly more, here are the geodemographic bins that the report used. They are taken from two widely used geodemographic segmentation tools, ACORN and MOSAIC.

ACORN (A Classification of Residential Neighbourhoods) is CACI’s geodemographic segmentation system of the UK population. We have used the 2010 version of ACORN which segments postcodes into 5 Categories, 17 Groups and 57 Types.

demog_segments4

demog_segments3

Mosaic UK is Experian’s geodemographic segmentation system of the UK population. We have used the 2009 version of Mosaic UK which segments postcodes into 15 Groups and 67 Household Types.

demog_segments2

demog_segments

The ACORN and MOSAIC data sets seem to provide data at the postcode level. I’m not sure how this was then combined with the HES data, but it seems the SIASIFoA folk found a way (p 29) [or as Anne-Marie Cunningham suggests in the comments, maybe it wasn’t combined by SIASIFoA – maybe it came that way?]:

The HES data records have been encoded with both an ACORN Type and a Mosaic UK Household Type. This enables hospital admissions to be split by ACORN and Mosaic Type. This covers the “claims” side of an incidence rate calculation. In order to determine the exposure, both CACI and Experian were able to provide us with the population of England, as at 2009 and 2010 respectively, split by gender, age band and profiler.

This then represents another area of concern – the extent to which even pseudonymised data can be combined with other data sets, for example based on geo-demographic data. So for example, how are the datasets actually combined, and what are the possible consequences of such combinations? Does the combination enrich the dataset in such a way that makes it easier for use to deanonymise either of the original datasets (if that is your primary concern); or does the combination occur in such a way that it may introduce systematic biases into models that are then produced by running summary statistics over groupings that are applied over the data, biases that may be unacknowedged (to possibly detrimental effect) when the models are used for predictive modelling, pricing models or as part of policy-making, for example?

Just by the by, I also wonder:

– what data was released lawfully under the old system that wouldn’t be allowed to be released now, and to whom, and for what purpose?
– are the people to whom that data was released allowed to continue using and processing that data?
– if they are allowed to continue using that data, under what conditions and for what purpose?
– if they are not, have they destroyed the data (16.05:44), for example by taking a sledgehammer to the computers the data was held on in the presences of NHS officers, or by whatever other means the state approves of?

See also: Is the UK Government Selling You Off?. For more on data linkage, see Some Random Noticings About Data Linkage.

Some Random Noticings About Data Linkage

Via a post on my colleague, and info law watchdog, Ray Corrigan’s blog – Alas medical confidentiality in the UK, we knew it well… – I note he has some concerns about the way in which the NHS data linkage service may be able to up its game as a result of the creation of the HSCIC – the Health and Social Care Information Centre – and it’s increasing access to data (including personal medical records?) held by GPs via the General Practice Extraction Service (GPES). (The HSCIC itself was established via legislation: Part 9 Chapter 2 of the Health and Social Care Act 2012. As I commented in The Business of Open Public Data Rolls On…, I think we need to keep a careful eye on (proposed) legislation that allows for “information of a prescribed description” to be made available to a “prescribed person” or “a person falling within a prescribed category”, where those prescriptions are left to the whim of the Minister responsible.) (Also via Ray, medConfidential has an interesting review of the HSCIC/GPES story so far.)

Something I hadn’t spotted before was the price list for data extraction and linkage services – just as interesting as the prices are the categories of service:

HSCIC datalinkage services

Here are the actual prices:

HSCIC data linkage price list

Complexity based on time to process-

3. A request is classed as ‘simple’ if specification, production and checking are expected to take less than 5 hours.
4. A request is classed as ‘medium’ if specification, production and checking are expected to take less than 7 hours but more than 5.
5. A request is classed as ‘complex’ if specification, production and checking are expected to take less than 12 hours but more than 7.

Doing a little search around the notion of “data linkage”, I stumbled across what looks to be quite a major data linkage initiative going on in Scotland – the Scotland Wide data linkage framework. There seems to have been a significant consultation exercise in 2012 prior to the establishment of this framework earlier this year: Data Linkage Framework Consultation [closed] [see for example the Consultation paper on “Aims and Guiding Principles” or the Technical Consultation on the Design of the Data Sharing and Linking Service [closed]]. Perhaps mindful of the fact that there may have been and may yet be public concerns around the notion of data linkage, an engagement exercise and report on Public Acceptability of Cross-Sectoral Data Linkage was also carried out (August 2012). A further round of engagement looks set so occur during November 2013.

I’m not sure what the current state of the framework, or its implementation, is (maybe this FOI request on Members and minutes of meetings of Data Linkage Framework Operations Group would give some pointers?) but one component of it at at least looks to be the Electronic Data Research and Innovation Service (eDRIS), a “one-stop shop for health informatics research”, apparently… Here’s the elevator pitch:

edris elevator pitch

Some examples of collaborative work are also provided:

– Linking data from NHS24 and Scottish Ambulance Service with emergency admissions and deaths data to understand unscheduled care patient pathways.
– Working with NHS Lothian to provide linked health data to support EuroHOPE – European Healthcare Outcomes, Performance and Efficiency Project Epidemiology, disease burden and outcomes of diverticular disease in Scotland
– Infant feeding in Scotland: Exploring the factors that influence infant feeding choices (within Glasgow) and the potential health and economic benefits of breastfeeding on child health

This got me wondering about what sorts of data linkage project things like HSCIC or the MoJ data lab (as reviewed here) might get up to. Several examples seem to to provided by the ESRC Administrative Data Liaison Service (ADLS): Summary of administrative data linkage. (For more information about the ADLS, see the Administrative Data Taskforce report Improving Access for Research and Policy.)

The ADLS itself was created as part of a three phase funding programme by the ESRC, which is currently calling for second phase bids for Business and Local Government Data Research Centres. I wonder if offering data linkage services will play a role in their remit? If so, I wonder if they will offer services along the lines of the ADLS Trusted Third Party Service (TTPS), which “provides researchers and data holding organisations a mechanism to enable the combining and enhancing of data for research to which may not have otherwise been possible because of data privacy and security concerns”? Apparently,

The [ADLS TTPS] facility is housed within a secure room within the Centre for Census and Survey Research (CCSR) at the University of Manchester, and has been audited by the Office for National Statistics. The room is only used to carry out disclosure risk assessment work and other work that requires access to identifiable data.”

Another example of a secure environment for data analysis is provided by the the HMRC Datalab. One thing I notice about that facility is that they don’t appear to allow expect researchers to use R (the software list identifies STATA 9/10/11, SAS 9.3, Microsoft Excel, Microsoft Word, SPSS Clementine 8.1/9.0/10.1/11.1/12)?

Why’s this important? Because little L, little D, linked data can provide a much richer picture than distinct data sets…

PS see also mosaic theory

PPS reminded by @wilm, here’s a “nice” example of data linkage from the New York Times… N.S.A. Gathers Data on Social Connections of U.S. Citizens.

PPPS and from the midata Innovation Lab, I notice this claim:

On the 4th of July 2013 we opened the midata Innovation Lab (mIL), on what we call “UK Consumer Independence Day”. So what is it? It’s the UK Government, leading UK companies and authoritative bodies collaborating on data services innovation and consumer protection for a data-driven future. We’ve put together the world’s fastest-built data innovation lab, creating the world’s most interesting and varied datasets, for the UK’s best brands and developers to work with.

The mIL is an accelerator for business to use a rich dataset to create new services for consumers. Designed in conjunction with innovative “Founding Partner” businesses, it also has oversight from authoritative bodies so we can create the world’s best consumer protection in the emerging personal data ecosystem.

The unique value of the lab is its ability to offer a unique dataset and consumer insight that it would be difficult for any one organization to collate. With expert input from authoritative consumer protection bodies, we can test and learn how to both empower and protect consumers in the emerging personal data ecosystem.

And this: “The personal data that we have asked for is focused on a few key areas: personal information including vehicle and property data, transactional banking and credit records, mobile, phone, broadband and TV billing information and utility bills.” It seems that data was collected from 50 individuals to start with.

Co-Director Network Data Files in GEXF and JSON from OpenCorporates Data via Scraperwiki and networkx

I’ve been tinkering with OpenCorporates data again, tidying up the co-director scraper described in Corporate Sprawl Sketch Trawls Using OpenCorporates (the new scraper is here: Scraperwiki: opencorporates trawler) and thinking a little about working with the data as a graph/network.

What I’ve been focussing on for now are networks that show connections between directors and companies, something we might imagine as follows:

comapny director netwrok

In this network, the blue circles represent companies and the red circles directors. A line connecting a director with a company says that the director is a director of that company. So for example, company C1 has just one director, specifically D1; and director D2 is director of companies C2 and C3, along with director D3.

It’s easy enough to build up a graph like this from a list of “company-director” pairs (or “relations”). These can be described using a simple two column data format, such as you might find in a simple database table or CSV (comma separated value) text file, where each row defines a separate connection:

Company Director
C1 D1
C2 D1
C2 D2
C2 D2
C3 D3
C3 D3

This is (sort of) how I’m representing data I’ve pulled from OpenCorporates, data that starts with a company seed, grabs the current directors of that target company, searches for other companies those people are directors of (using an undocumented OpenCorporates search feature – exact string matching on the director search (put the direction name in double quotes…;-), and then captures which of those companies share are least two directors with the original company.

In order to turn the data, which looks like this:

OpenCorporates data

into a map that resembles something like this (this is actually a view over a different dataset):

care uk sprawl

we need to do a couple of things. Working backwards, these are:

  1. use some sort of tool to generate a pretty picture from the data;
  2. get the data out of the table into the tool using an appropriate exchange format.

Tools include desktop tools such as Gephi (which can import data directly from a CSV file or database table), or graph viewers such as the sigma.js javascript library, or d3.js with an appropriate plugin.

Note that the positioning of the nodes in the visualisation may be handled in a couple of ways:

  • either the visualisation tool uses a layout algorithm to work out the co-ordinates for each of the nodes; or
  • the visualisation tool is passed a graph file that contains the co-ordinates saying where each node should be placed; the visualisation tool then simply lays out the graph using those provided co-ordinates.

The dataflow I’m working towards looks something like this:

opencorporates graphflow

networkx is a Python library (available on Scraperwiki) that makes it easy to build up representations of graphs simply by adding nodes and edges to a graph data structure. networkx can also publish data in a variety of handy exchange formats, including gexf (as used by Gephi and sigma.js), and a JSON graph representation (as used by d3.js and maybe sigma.js (example plugin?).

As a quick demo, I’ve built a scraperwiki view (opencorporates trawler gexf) that pulls on a directors_ table from my opencorporates trawler and then publishes the information either as gexf file (default) or as a JSON file using URLs of the form:

https://views.scraperwiki.com/run/opencorporates_trawler_gexf/?key=compassFood2_2 (gexf default)
https://views.scraperwiki.com/run/opencorporates_trawler_gexf/?key=compassFood2_2&output=json
https://views.scraperwiki.com/run/opencorporates_trawler_gexf/?key=compassFood2_2&output=gexf

This view can therefore be used to easily export data from my OpenCorporates trawler as a gexf file that can be used to easily import data into the Gephi desktop tool, or provide a URL to some JSON data that can be visualised using a Javscript library within a web page (I started doodling the mechanics of one example here: sigmajs test; better examples of what’s possible can be seen at Exploring Data and on the Oxford Internet Institute – Visualisations blog. If anyone would like to explore building a nice GUI to my OpenCorporates trawl data, feel free:-).

We can also use networks to publish data based on processing the network. The example graph above shows a netwrok with two sorts of nodes, connected by edges: company nodes and director nodes. This is a special sort of graph in that companies are only ever connected to directors, and directors are only ever connected to companies. That is, the nodes fall into one of two sorts – company or director – and they only ever connect “across” node type lines. If you look at this sort of graph (sometimes referred to as a bipartite or bimodal graph) for a while, you might be able to spot how you can fiddle with it (technical term;-) to get a different view over the data, such as those directors connected to other directors by virtue of being directors of the same company:

Director network

or those companies that are connected by virtue of sharing common directors:

company network

(Note that the lines/edges can be “weighted” to show the number of connections relating two companies or directors (that is, the number of companies that two directors are connected by, or the number of directors that two companies are connected by). We can then visually depict this weight using line/edge thickness.)

The networkx library conveniently provides functions for generating such views over the data, which can also be accessed via my scraperwiki view:

As the view is paramaterised via a URL, it can be used as a form of “glue logic” to bring data out of a directors table (which itself was populated by mining data from OpenCorporates in a particular way) and express it in a form that can be directly plugged in to a visualisation toolkit. Simples:-)

PS related: a templating system by Craig Russell for generating XML feeds from Google Spreadsheets – EasyOpenData.