In What Role, If Any, Does Spending Data Have to Play in Local Council Budget Consultations? I started wondering about the extent to which local spending transparency data might play a role in supporting consultation around new budgets.
As a first pass, I’ve popped up a quick application up at http://glimmer.rstudio.com/psychemedia/iwspend2013_14/ [if that’s broken, try this one] (shiny code here) that demonstrates various ways of looking at open spending data from the Isle of Wight council. You can pass form items in via the URL (except to set the Directorate – oops!), and also search using regular expressions, but at the moment still need to hit the Search button to actually run the search. NOTE – there’s a little bug – you need to hit the Search button to get it to show data; note – selecting All directorates and no filter terms can be a bit slow to display anything…
Examples:
– http://glimmer.rstudio.com/psychemedia/iwspend2013_14/?expensesType=(oil)|(gas)|(electricity)
– http://glimmer.rstudio.com/psychemedia/iwspend2013_14/?serviceArea=mainland
– http://glimmer.rstudio.com/psychemedia/iwspend2013_14/?supplierName=capita
I’ve started exploring various views over the data, but these need thinking through properly (in particular with respect to finding out views that may actually be useful!)
Hmm… did the budget change directorate?!
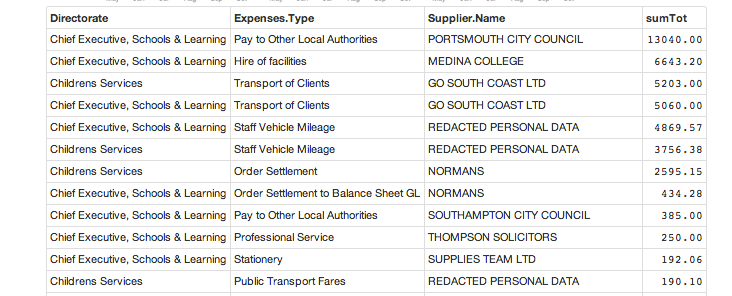
Some more views over the suppliers tab – I started experimenting with some tabular views in the suppliers tab too…
This is all very “shiny” of course, but is it useful? From these early glimpses over the data, can you think of any ways that a look at the spending data might help support budget consultations? What views over the data, in particular, might support such an aim, and what sort of stories might we be able to tell around this sort of data?


Nice work, but one suggestion: your plots could be easier to read if you used direct labels instead of legends. http://directlabels.r-forge.r-project.org/
@toby Thanks – good suggestion; the charts were thrown together as a really quick set of sketches. I’ll try to get the labels sorted next time I get to play with the code:-)