In a post a couple of weeks ago – COuRsE Data – I highlighted several example questions that might usefully be asked of course data, thinks like “which modules are associated with any particular qualification?” or “which modules deliver which qualification level learning outcomes?”.
As the University of Lincoln ONCourse project comes to an end [disclosure: I am contracted on the project to do some evaluation], I thought it might be interesting to explore the API that’s been produced to see just what sorts of question we might be able to ask, out of the can.
Note that I don’t have privileged access to the database (though I could possibly request read access, or maybe even a copy of the database, or at least its schema), but that’s not how I tend to work. I play with things that are in principle publicly available, ideally things via openly published URLs and without authentication (no VPN); using URL parameter keys is about as locked down as I can usually cope with;-)
So what’s available? A quick skim of the Objects returned via the API turns up some potentially interesting sounding ones in a course data context, such as: Accrediting Body, Assessment, Contact Type and Time, Course Code, Delivery Mode, Learning Outcome, Module Code, Programme Outcome.
So let’s just pick one and see how far we can get… We can start at the bottom maybe, which is presumably Module.
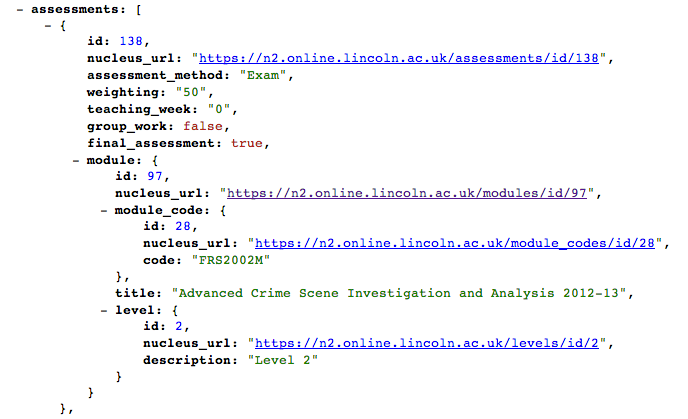
A call to the API on /modules returns listings of the form:
{
  id: 97,
  nucleus_url: "https://n2.online.lincoln.ac.uk/modules/id/97",
  module_code: {
    id: 28,
    nucleus_url: "https://n2.online.lincoln.ac.uk/module_codes/id/28",
    code: "FRS2002M"
  },
  title: "Advanced Crime Scene Investigation and Analysis 2012-13",
  level: {
    id: 2,
    nucleus_url: "https://n2.online.lincoln.ac.uk/levels/id/2",
    description: "Level 2"
  }
}
Looking at the record for an actual module gives us a wealth of data, including: the module code, level and number of credit points; a synopsis and marketing synopsis; an outline syllabus (unstructured text, which could cause layout problems?); the learning and teaching strategy and assessment strategy; a set of module links to programmes the module is associated with, along with core programme data; a breakdown of contact time and assessments; and prerequisites, co-requisites and excluded combinations.
There does appear to be some redundancy in the data provided for a module, though this is not necessarily a bad thing in pragmatic terms (it can make like convenient). For example, the top level of a modules/id record looks like this:

and lower down the record, in the /assessments element we get duplication of the data:
As something of a tinkerer, this sort of thing works for me – I can grab the /assessments object out of a modules/id result and pass it around with the corresponding module data neatly bundled up too. But a puritan might take issue with the repetition…
Out of the box then, I can already start to write queries on a module if I have the module ID. I’ll give some code snippets of example Python routines as I play my way through the API…
import urllib2, json
def gurl(url):
return json.load(urllib2.urlopen(url))
def jgrabber(u):
root='https://n2.online.lincoln.ac.uk'
return gurl(root+u)
#Note that API calls are actually signed with a key (not show in URLs)
def dd(): print "-----"
#Can I look up the programmes associated with a module given its ID?
def grabModulesId(id):
return jgrabber( '/modules/id/'+str(id) )['result']
def printProgsFromModuleID(moduleID,d=''):
if d=='': d=grabModulesId(moduleID)
dd()
print 'Module:', d['title'], '(', d['module_code']['code'], d['level']['description'], ',', d['credit_rating'], 'points)'
dd()
for r in d['module_links']:
print 'Programme:', r['programme']['programme_title']
print 'Course:', r['programme']['course_title'], "(",r['programme']['course_code']['code'],")"
dd()
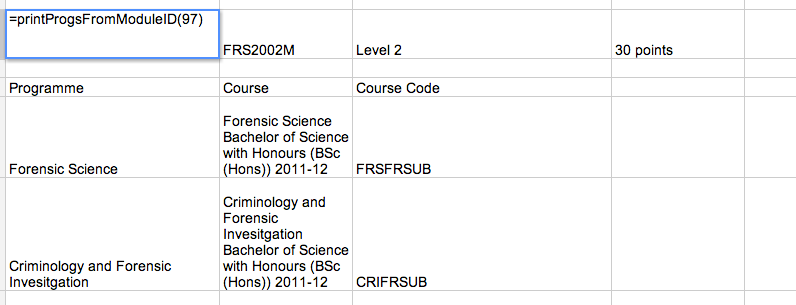
'''Example result:
>>> printProgsFromModuleID(97)
-----
Module: Advanced Crime Scene Investigation and Analysis 2012-13 ( FRS2002M Level 2 , 30 points)
-----
Programme: Forensic Science
Course: Forensic Science Bachelor of Science with Honours (BSc (Hons)) 2011-12 ( FRSFRSUB )
-----
Programme: Criminology and Forensic Invesitgation
Course: Criminology and Forensic Invesitgation Bachelor of Science with Honours (BSc (Hons)) 2011-12 ( CRIFRSUB )
'''
The /module_codes call then allows us to see when this module was presented:
#When was a module presented?
def grabModuleCodesId(id):
  return jgrabber( '/module_codes/id/'+str(id) )['result']

def printPresentationsFromModuleCode(moduleCode,d=''):
  if d=='': d=grabModuleCodesId(moduleCode)
  dd()
  print 'Presentations of',d['code']
  dd()
  for r in d['modules']:
    print r['title']
  dd()

'''Example result:

>>> printPresentationsFromModuleCode(28)
-----
Presentations of FRS2002M
-----
Advanced Crime Scene Investigation and Analysis 2010-11
Advanced Crime Scene Investigation and Analysis 2011-12
Advanced Crime Scene Investigation and Analysis 2012-13
Advanced Crime Scene Investigation and Analysis 2013-14
-----
'''
We can also tweak the first query to build a bigger report. For example:
#Combination effect
def getModuleCodeFromModuleID(moduleID,d=''):
  if d=='':d=grabModulesId(moduleID)
  return d['module_code']['id']

moduleID=97

d=grabModulesId(moduleID)
printProgsFromModuleID(moduleID,d)

moduleCode = getModuleCodeFromModuleID(moduleID,d)
printPresentationsFromModuleCode(moduleCode)
One thing I’m not sure about is the way in to a moduleID in the first instance? For example, I’d like to be able to straightforwardly be able to get the IDs for any upcoming presentations of FRS2002M in the current academic year?
So what else might we be able to do around a module? How about check out its learning outcomes? My first thought was the learning outcomes might be available from the /modules data (i.e. actual module presentations), but they don’t seem to be there. Next thought was to look for them in the abstracted module definition (from the module_codes), but again: no. Hmmm… Assessments are associated with a module, so maybe that’s where the learning outcomes come in (as subservient to assessment rather than a module?)
The assessment record in the module data looks like this:

And if we click to to an assessment record we get something like this, which does include Learning Outcomes:

Philosophically, I’m not sure about this? I know that assessment is supposed to be tied back to LOs, and quality assurance around a course and its assessment is typically a driver for the use of LOs. But if we can only find the learning outcomes associated with a module via its assessment..? Hmmm… Data modeling is often fraught with philosophical problems, and I think is is one such case?
Anyway, how might we report on the learning outcomes associated with a particular module presentation? Here’s one possible way:
#Look up assessments
def assessmentByModuleID(moduleID,d=''):
  if d=='':d=grabModulesId(moduleID)
  return d['assessments']

#Look up learning outcomes
def learningOutcomesByModuleID(moduleID,d=''):
  if d=='': d=assessmentByModuleID(moduleID)
  dd()
  for r in d:
    assessment=gurl(r['nucleus_url'])['result']
    print assessment['module']['title'], '(', assessment['module']['module_code']['code'], ')', assessment['assessment_method'],'Learning Outcomes:'
    learningOutcomes=assessment['learning_outcomes']
    for learningOutcome in learningOutcomes:
      print '\t- ',learningOutcome['description']
    dd()

#Example call
learningOutcomesByModuleID(97)

'''Example output

Advanced Crime Scene Investigation and Analysis 2012-13 ( FRS2002M ) Exam Learning Outcomes:
	-  Identify factors which affect persistence and transfer of trace evidence materials and demonstrate practical skills in recovery and physical and chemical analysis of trace evidence using a variety of specialised techniques
	-  Discriminate different types of hairs and fibres on the basis of morphology and optical (e.g. birefringence) and chemical properties (e.g. dye composition)
...
'''
We can also query the API to get a list of learning outcomes directly, and this turns up a list of assessments as well as the single (?) module associated with the learning outcome. Does this mean that a particular learning outcome can’t be associated with two modules? I’m not sure that’s right? Presumably, database access would allow us to query learning outcomes by moduleID?
Okay – that’s probably enough for now. The API seems to be easy enough to use, and I guess it wouldn’t be too hard to come up with some Google Spreadsheet formulae to demonstrate how they could be used to pull the course data into that sort of workspace (eg along the lines of Using Data From Linked Data Datastores the Easy Way (i.e. in a spreadsheet, via a formula)).
In the next post, I’ll a peak at some of the subject keywords, and maybe have a play at walking through the data in order to generate some graphs (eg maybe along the lines of what Jamie has tried out previously: In Search of Similar Courses). There;s also programme level outcomes, so it might be interesting trying do do some sort of comparison between those and the learning outcomes associated with assessment in modules on a programme. And all this, of course, without (too much) privileged access…
PS Sod’s Law from Lincoln’s side means that even though I only touched a fragment of the data, I turned up some errors. So for example, in the documentation on bitbucket the award.md “limit” var was class as a “bool” rather than an “int” (which suggests a careful eye maybe needs casting over all the documentation. Or is that supposed to be my job?! Erm…;-) In programme/id=961 there are a couple of typos: programme_title: “Criminology and Forensic Invesitgation”, course_title: “Criminology and Forensic Invesitgation Bachelor of Science with Honours (BSc (Hons)) 2011-12”. Doing a bit of text mining on the data and pulling out unique words can help spot some typos, though in the above case Invesitgation would appear at least twice. Hmmm…
Looking at some of the API calls, it would be generally useful to have something along the lines of offset=N to skip the first N results, as well as returning “total-Results=” in the response. Some APIs provide helper data along the lines of “next:” where eg next=offset+num_results that can be plugged in as the offset in the next call if you want to roll your own paging. (This may be in the API, but I didn’t spot it?). When scripting this, care just needs be taken to check that a fence post error doesn’t sneak in.
Okay – enough for now. Time to go and play in the snow before it all melts…