Slackbot Data Wire, Initial Sketch

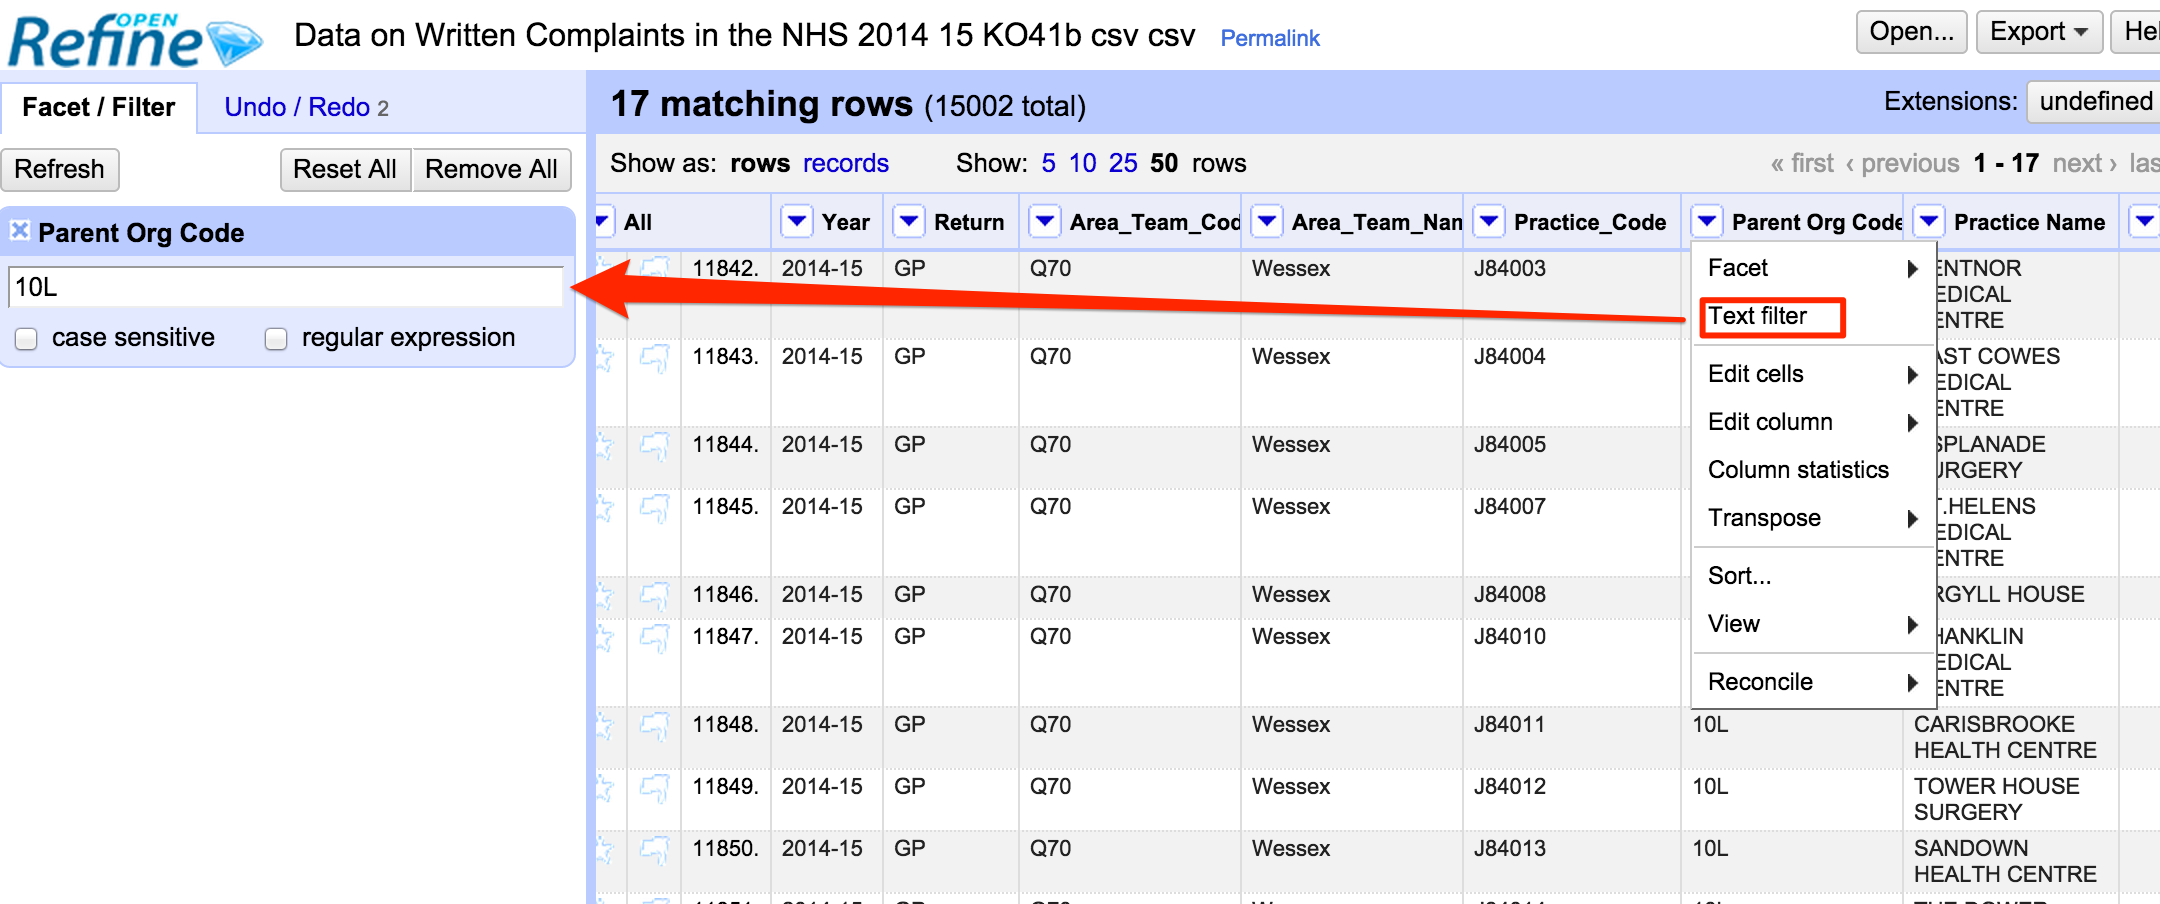
Via a round-up post from Matt Jukes/@jukesie (Interesting elsewhere: Bring on the Bots), I was prompted to look again at Slack. OnTheWight’s Simon Perry originally tried to hook me in to Slack, but I didn’t need another place to go to check messages. Simon had also mentioned, in passing, how it would be nice to be able to get data alerts into Slack, but I’d not really followed it through, until the weekend, when I read again @jukesie’s comment that “what I love most about it [Slack] is the way it makes building simple, but useful (or at least funny), bots a breeze.”

After a couple of aborted attempts, I found a couple of python libraries to wrap the Slack API: pyslack and python-rtmbot (the latter also requires python-slackclient).

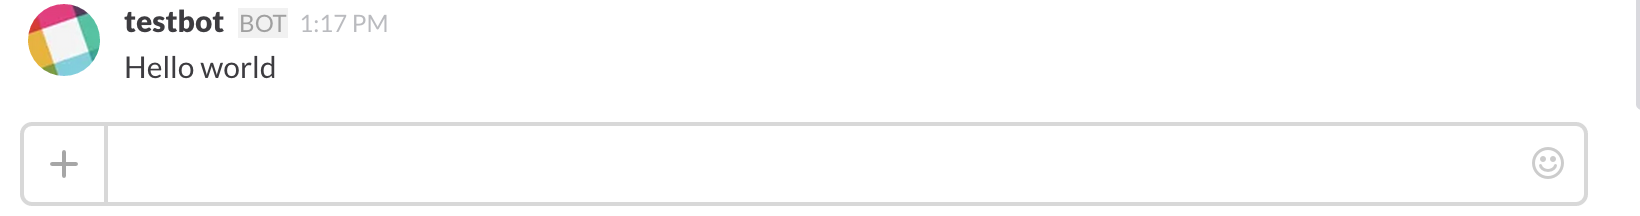
Using pyslack to send a message to Slack was pretty much a one-liner:

#Create API token at https://api.slack.com/web
token='xoxp-????????'

#!pip install pyslack
import slack
import slack.chat
slack.api_token = token
slack.chat.post_message('#general', 'Hello world', username='testbot')

general___OUseful_Slack

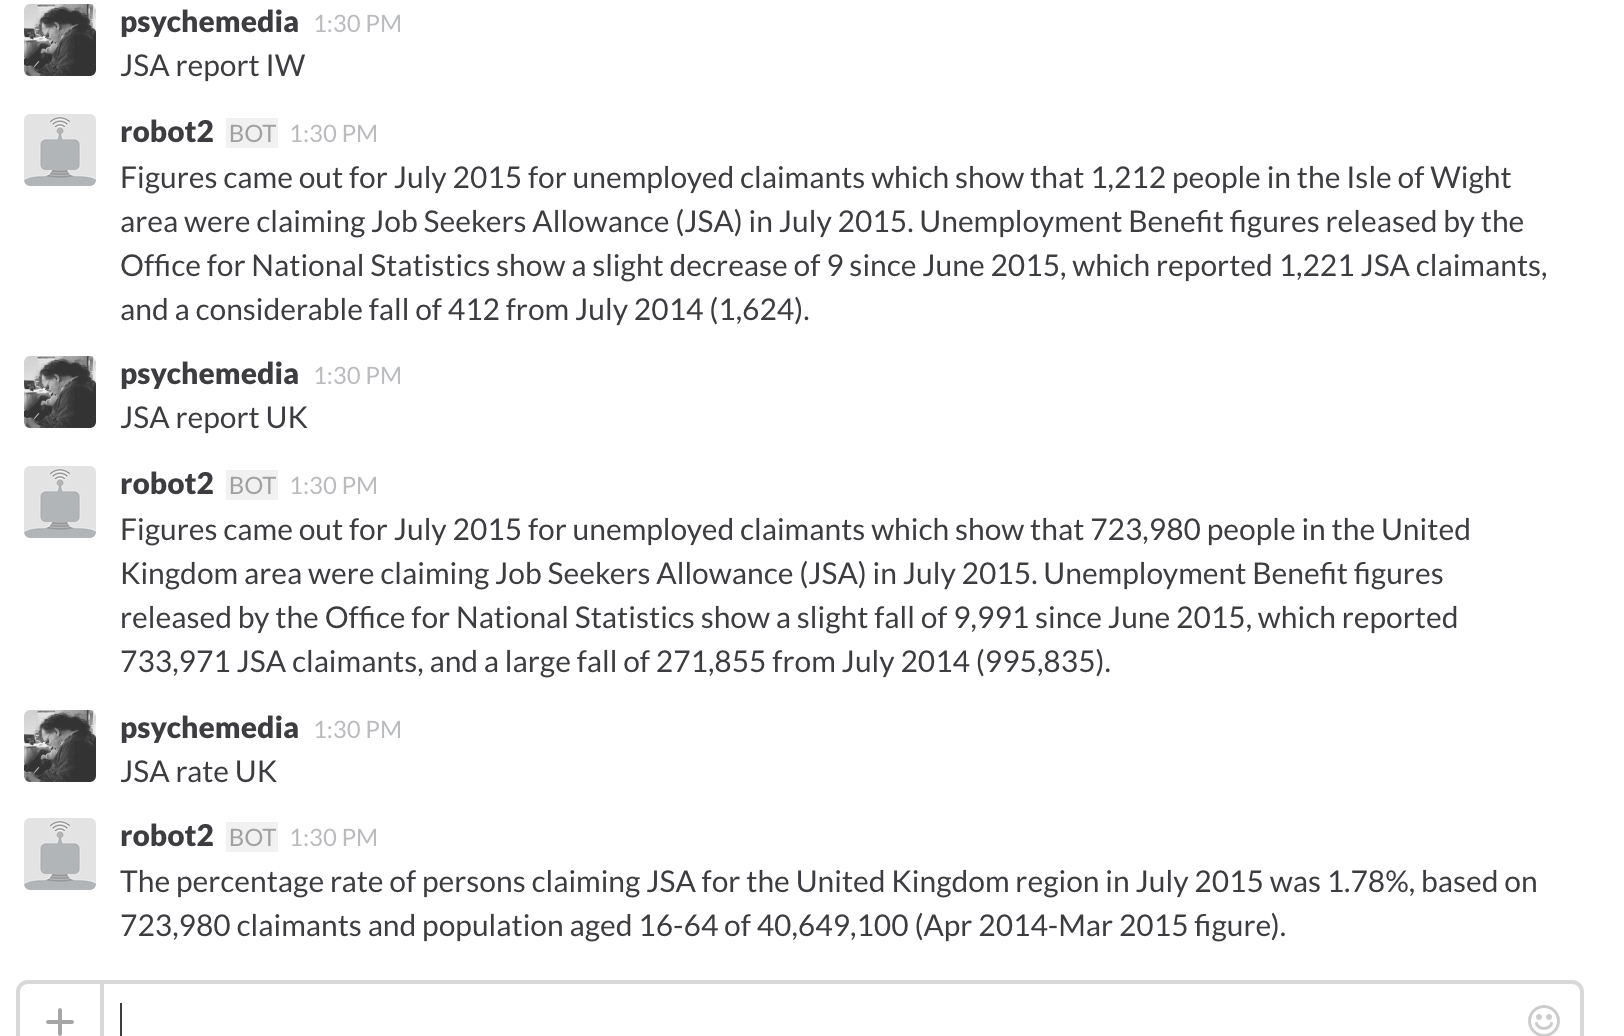
I was quite keen to see how easy it would be to reuse one of more of my data2text sketches as the basis for an autoresponder that could get accept a local data request from a Slack user and provide a localised data response using data from a national dataset.

I opted for a JSA (Jobseekers Allowance) textualiser (as used by OnTheWight and reported here: Isle of Wight innovates in a new area of Journalism and also in this journalism.co.uk piece: How On The Wight is experimenting with automation in news) that I seem to have bundled up into a small module, which would let me request JSA figures for a council based on a council identifier. My JSA textualiser module has a couple of demos hardwired into it (one for the Isle of Wight, one for the UK) so I could easily call on those.

To put together an autoresponder, I used the python-rtmbot, putting the botcode folder into a plugins folder in the python-rtmbot code directory.

The code for the bot is simple enough:

from nomis import *
import nomis_textualiser as nt
import pandas as pd

nomis=NOMIS_CONFIG()

import time
crontable = []
outputs = []

def process_message(data):

	text = data["text"]
	if text.startswith("JSA report"):
		if 'IW' in text: outputs.append([data['channel'], nt.otw_rep1(nt.iwCode)])
		elif 'UK' in text: outputs.append([data['channel'], nt.otw_rep1(nt.ukCode)])
	if text.startswith("JSA rate"):
		if 'IW' in text: outputs.append([data['channel'], nt.rateGetter(nt.iwCode)])
		elif 'UK' in text: outputs.append([data['channel'], nt.rateGetter(nt.ukCode)])

general___OUseful_Slack2

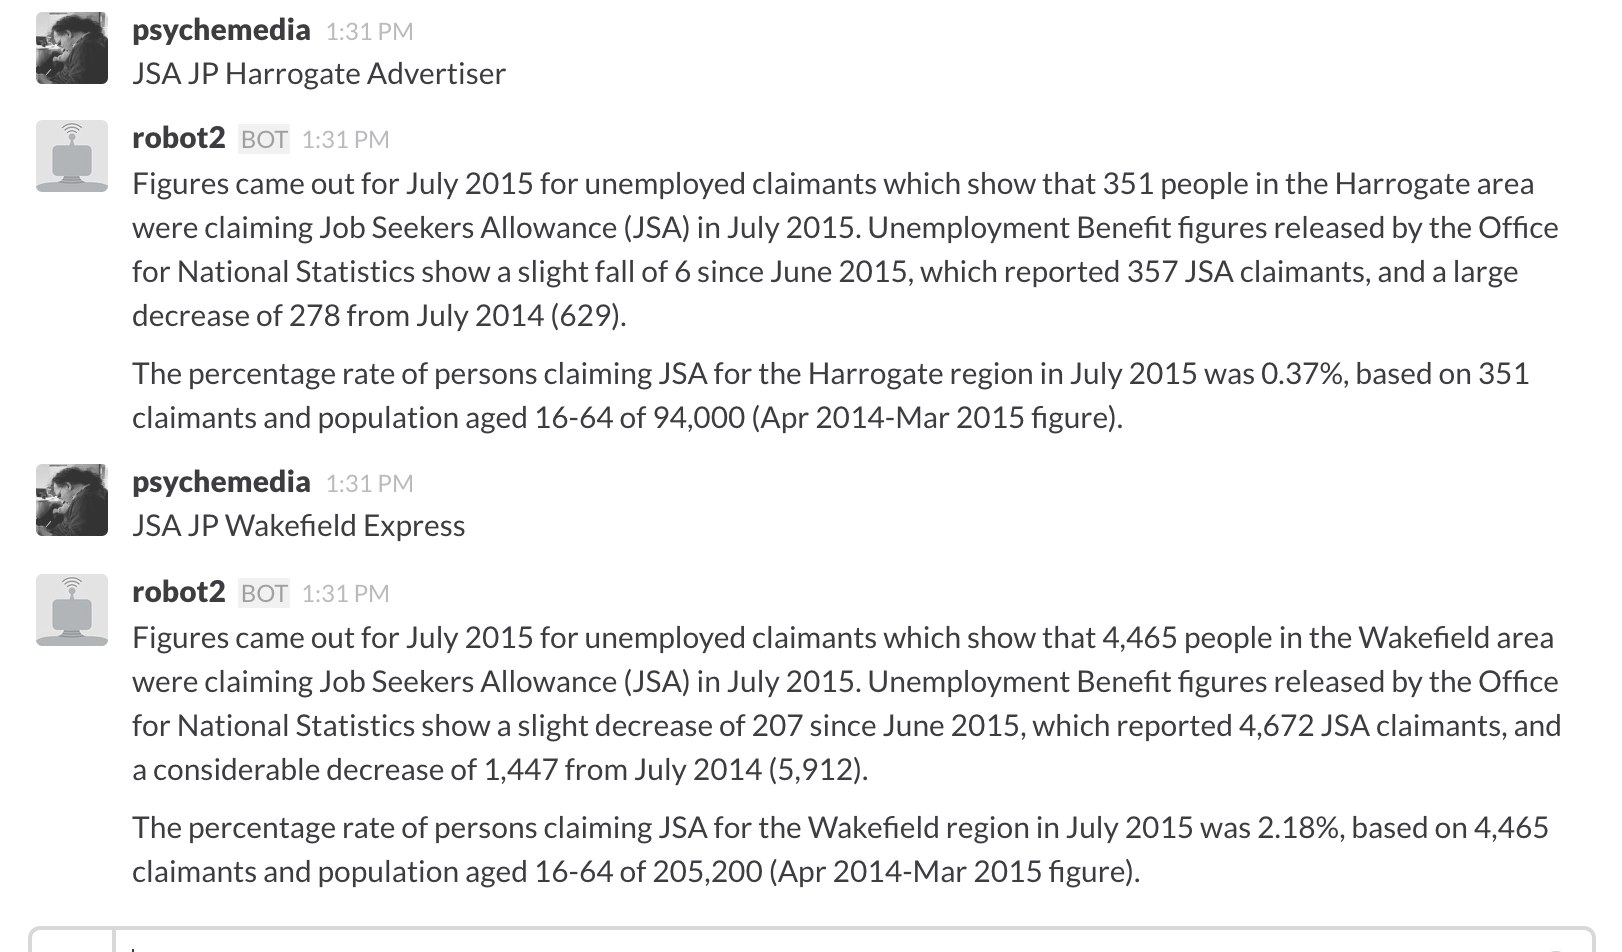
Rooting around, I also found a demo I’d put together for automatically looking up a council code from a Johnston Press newspaper title using a lookup table I’d put together at some point (I don’t remember how!).

Which meant that by using just a tiny dab of glue I could extend the bot further to include a lookup of JSA figures for a particular council based on the local rag JP covering that council. And the glue is this, added to the process_message() function definition:

	def getCodeForTitle(title):
		code=jj_titles[jj_titles['name']==title]['code_admin_district'].iloc[0]
		return code

	if text.startswith("JSA JP"):
		jj_titles=pd.read_csv("titles.csv")
		title=text.split('JSA JP')[1].strip()
		code=getCodeForTitle(title)

		outputs.append([data['channel'], nt.otw_rep1(code)])
		outputs.append([data['channel'], nt.rateGetter(code)])

general___OUseful_Slack3

This is quite an attractive route, I think, for national newsgroups: anyone in the group can create a bot to generate press release style copy at a local level from a national dataset, and then make it available to reporters from other titles in the group – who can simply key in by news title.

But it could work equally well for a community network of hyperlocals, or councils – organisations that are locally based and individually do the same work over and over again on national datasets.

The general flow is something a bit like this:

Tony_Hirst_-_Cardiff_-_community_journalism_-_data_wire_pptx

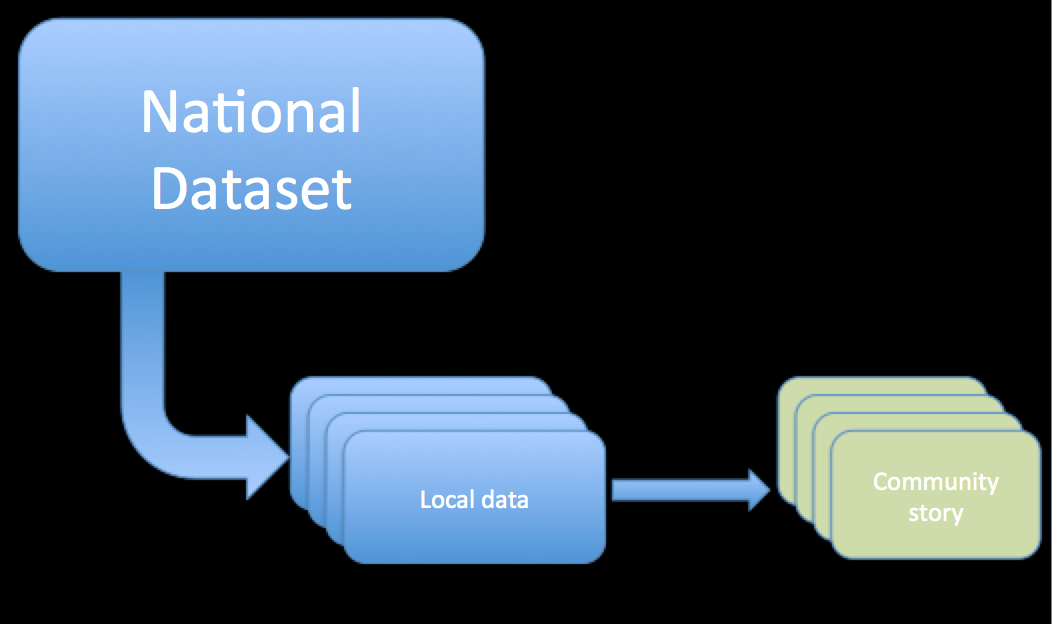
which has a couple of very obvious pain points:

Tony_Hirst_-2_Cardiff_-_community_journalism_-_data_wire_pptx

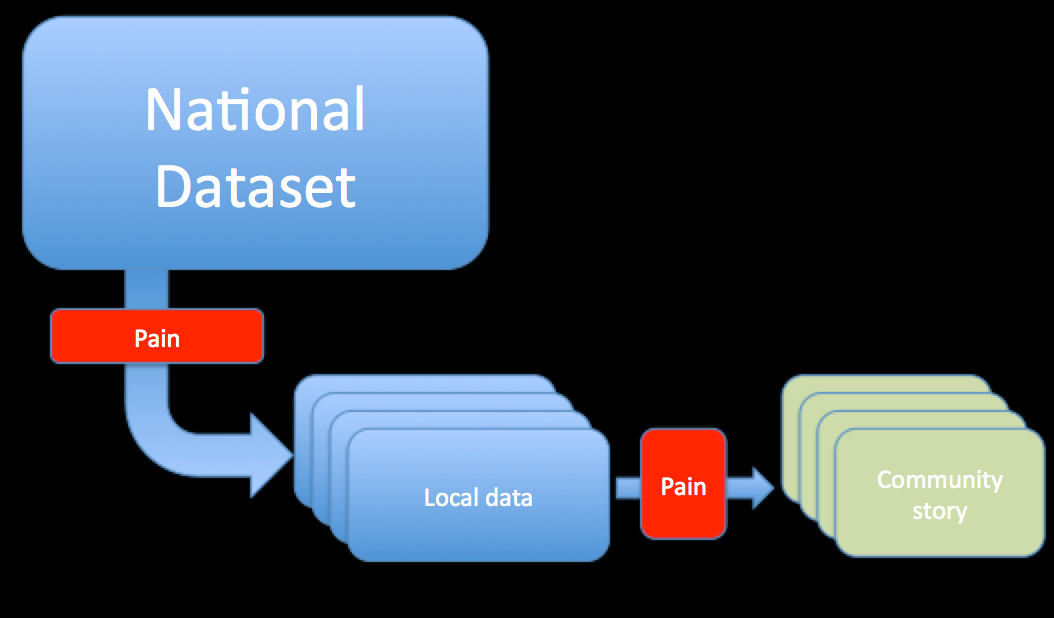
Firstly, finding the local data from the national data, cleaning the data, etc etc. Secondly, making some sort of sense of the data, and then doing some proper journalistic work writing a story on the interesting bits, putting them into context and explaining them, rather than just relaying the figures.

What the automation route does is to remove some of the pain, and allow the journalist to work up the story from the facts, presented informatively.

Tony_Hirst_-3_Cardiff_-_community_journalism_-_data_wire_pptx

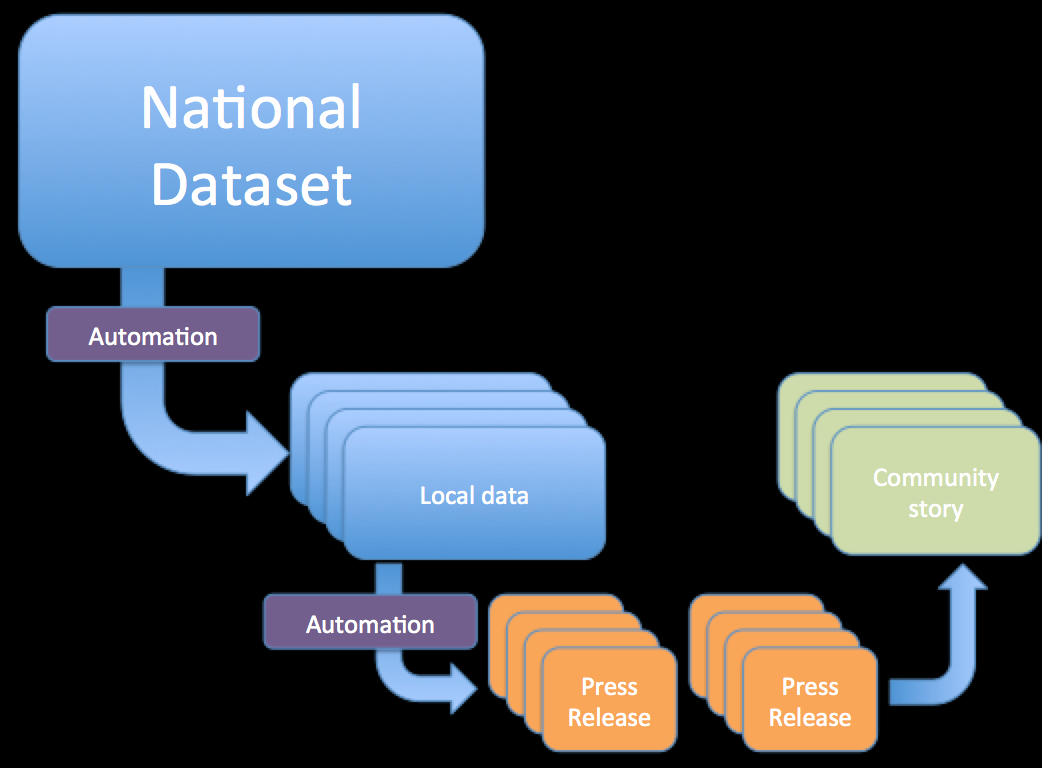
This is a model I’m currently trying to work up with OnTheWight and one I’ll be talking about briefly at the What next for community journalism? event in Cardiff on Wednesday [slides].

PS Hmm.. this just in, The Future of the BBC 2015 [PDF] [announcement].

Local Accountability Reporting Service

Under this proposal, the BBC would allocate licence fee funding to invest in a service that reports on councils, courts and public services in towns and cities across the UK. The aim is to put in place a network of 100 public service reporters across the country.

Reporting would be available to the BBC but also, critically, to all reputable news organisations. In addition, while it would have to be impartial and would be run by the BBC, any news organisation — news agency, independent news provider, local paper as well as the BBC itself—could compete to win the contract to provide the reporting team for each area.

A shared data journalism centre Recent years have seen an explosion in data journalism. New stories are being found daily in government data, corporate data, data obtained under the Freedom of Information Act and increasing volumes of aggregated personalised data. This data offers new means of sourcing stories and of holding public services, politicians and powerful organisations to account.

We propose to create a new hub for data journalism, which serves both the BBC and makes available data analysis for news organisations across the UK. It will look to partner a university in the UK, as the BBC seeks to build a world-class data journalism facility that informs local, national and global news coverage.

A News Bank to syndicate content

The BBC will make available its regional video and local audio pieces for immediate use on the internet services of local and regional news organisations across the UK.

Video can be time-consuming and resource-intensive to produce. The News Bank would make available all pieces of BBC video content produced by the BBC’s regional and local news teams to other media providers. Subject to rights and further discussion with the industry we would also look to share longer versions of content not broadcast, such as sports interviews and press conferences.

Content would be easily searchable by other news organisations, making relevant material available to be downloaded or delivered by the outlets themselves, or for them to simply embed within their own websites. Sharing of content would ensure licence fee payers get maximum value from their investment in local journalism, but it would also provide additional content to allow news organisations to strengthen their offer to audiences without additional costs. We would also continue to enhance linking out from BBC Online, building on the work of Local Live.

Hmm… Share content – or share “pre-content”. Use BBC expertise to open up the data to more palatable forms, forms that the BBC’s own journalists can work with, but also share those intermediate forms with the regionals, locals and hyperlocals?

Data Literacy – Do We Need Data Scientists, Or Data Technicians?

One of the many things I vaguely remember studying from my school maths days are the various geometric transformations – rotations, translations and reflections – as applied particularly to 2D shapes. To a certain extent, knowledge of these operations helps me use the limited Insert Shape options in Powerpoint, as I pick shapes and arrows from the limited palette available and then rotate and reflect them to get the orientation I require.

But of more pressing concern to me on a daily basis is the need to engage in data transformations, whether as summary statistic transformations (find the median or mean values within several groups of the same dataset, for example, or calculating percentage differences away from within group means across group members for multiple groups, or shape transformations, reshaping a dataset from a wide to a long format, for example, melting a subset of columns or recasting a molten dataset into a wider format. (If that means nothing to you, I’m not surprised. But if you’ve ever worked with a dataset and copied and pasted data from multiple columns in to multiple rows to get it to look right/into the shape you want, you’ve suffered by not knowing how to reshape your dataset!)

Even though I tinker with data most days, I tend to avoid all but the simplest statistics. I know enough to know I don’t understand most statistical arcana, but I suspect there are folk who do know how to do that stuff properly. But what I do know from my own tinkering is that before I can run even the simplest stats, I often have to do a lot of work getting original datasets into a state where I can actually start to work with them.

The same stumbling blocks presumably present themselves to the data scientists and statisticians who not only know how to drive arcane statistical tests but also understand how to interpret and caveat them. Which is where tools like Open Refine come in…

Further down the pipeline are the policy makers and decision makers who use data to inform their policies and decisions. I don’t see why these people should be able to write a regexp, clean a dirty dataset, denormalise a table, write a SQL query, run a weird form of multivariate analysis, or reshape a dataset and then create a novel data visualisation from it based on a good understanding of the principles of The Grammar of Graphics; but I do think they should be able to pick up on the stories contained within the data and critique the way it is presented, as well as how the data was sourced and the operations applied to it during analysis, in addition to knowing how to sensibly make use of the data as part of the decision making or policy making process.

A recent Nesta report (July 2015) on Analytic Britain: Securing the right skills for the data-driven economy [PDF] gave a shiny “analytics this, analytics that” hype view of something or other (I got distracted by the analytics everything overtone), and was thankfully complemented by a more interesting report from the Universities UK report (July 2015) on Making the most of data: Data skills training in English universities [PDF].

In its opening summary, the UUK report found that “[t]he data skills shortage is not simply characterised by a lack of recruits with the right technical skills, but rather by a lack of recruits with the right combination of skills”, and also claimed that “[m]any undergraduate degree programmes teach the basic technical skills needed to understand and analyse data”. Undergrads may learn basic stats, but I wonder how many of them are comfortable with the hand tools of data wrangling that you need to be familiar with if you ever want to turn real data into something you can actually work with? That said, the report does give a useful review of data skills developed across a range of university subject areas.

(Both reports championed the OU-led urban data school, though I have to admit I can’t find any resources associated with that project? Perhaps the OU’s Smart Cities MOOC on FutureLearn is related to it? As far as I know, OUr Learn to Code for Data Analysis MOOC isn’t?)

From my perspective, I think it’d be a start if folk learned:

  • how to read simple charts;
  • how to identify meaningful stories in charts;
  • how to use data stories to inform decision making.

I also worry about the day-to-day practicalities of working with data in a hands on fashion and the roles associated with various data related tasks that fall along any portrayal of the data pipeline. For example, of the top of my head I think we can distinguish between things like:

  • data technician roles – for example, reshaping and cleaning datasets;
  • data engineering roles – managing storage, building and indexing databases, for example;
  • data analyst/science and data storyteller roles – that is, statisticians who can work with clean and well organised datasets to pull out structures, trends and patterns from within them;
  • data graphics/visualisation practitioners – who have the eye and the skills for developing visual ways of uncovering and relating the stories, trends, patterns and structures hidden in datasets, perhaps in support of the analyst, perhaps in support of the decision-making end-user ;
  • and data policymakers and data driven decision makers, who can phrase questions in such a way that makes it possible to use data to inform the decision or policymaking process, even if they don’t have to skills to wrangle or analyse the data that they can then use.

I think there is also a role for data questionmasters who can phrase and implement useful and interesting queries that can be applied to datasets, which might also fall to the data technician. I also see a role for data technologists, who are perhaps strong as a data technician, but with an appreciation of the engineering, science, visualisation and decision/policy making elements, though not necessarily strong as a practitioner in any of those camps.

(Data carpentry as a term is also useful, describing a role that covers many of the practical skills requirements I’d associate with a data technician, but that additionally supports the notion of “data craftsmanship”? A lot of data wrangling does come down to being a craft, I think, not least because the person working at the raw data end of the lifecycle may often develop specialist, hand crafted tools for working with the data that an analyst would not be able to justify spending the development time on.)

Here’s another carving of the data practitioner roles space, this time from Liz Lyon & Aaron Brenner (Bridging the Data Talent Gap: Positioning the iSchool as an Agent for Change, International Journal of Digital Curation, 10:1 (2015)):

Bridging_the_Data_Talent_Gap__Positioning_the_iSchool_as_an_Agent_for_Change___Lyon___International_Journal_of_Digital_Curation

The Royal Statistical Society Data Manifesto [PDF] (September 2014) argues for giving “[p]oliticians, policymakers and other professionals working in public services (such as regulators, teachers, doctors, etc.) … basic training in data handling and statistics to ensure they avoid making poor decisions which adversely affect citizens” and suggest that we need to “prepare for the data economy” by “skill[ing] up the nation”:

We need to train teachers from primary school through to university lecturers to encourage data literacy in young people from an early age. Basic data handling and quantitative skills should be an integral part of the taught curriculum across most A level subjects. … In particular, we should ensure that all students learn to handle and interpret real data using technology.

I like the sentiment of the RSS manifesto, but fear the Nesta buzzword hype chasing and the conservatism of the universities (even if the UUK report is relatively open minded).

On the one hand, we often denigrate the role of the technician, but I think technical difficulties associated with working with real data are often a real blocker; which means we either skill up ourselves, or recognise the need for skilled data technicians. On the other, I think there is a danger of hyping “analytics this” and “data science that” – even if only as part of debunking it – because it leads us away from the more substantive point that analytics this, data science that is actually about getting numbers into a form that tell stories that we can use to inform decisions and policies. And that’s more about understanding patterns and structures, as well as critiquing data collection and analysis methods, than it is about being a data technician, engineer, analyst, geek, techie or quant.

Which is to say – if we need to develop data literacy, what does that really mean for the majority?

PS Heh heh – Kin Lane captures further life at the grotty end of the data lifecycle: Being a Data Janitor and Cleaning Up Data Portability Vomit.

Converting Spreadsheet Rows to Text Based Summary Reports Using OpenRefine

In Writing Each Row of a Spreadsheet as a Press Release? I demonstrated how we could generate a simple textual report template that could “textualise” separate rows of a spreadsheet. This template could be applied to each row from a subset of rows to to produce a simple human readable view of the data contained in each of those rows. I picked up on the elements of this post in Robot Journalists or Robot Press Secretaries?, where I reinforced the idea that such an approach was of a similar kind to the approach used in mail merge strategies supported by many office suites.

It also struck me that we could use OpenRefine’s custom template export option to generate a similar sort of report. So in this post I’ll describe a simple recipe for recreating the NHS Complaints review reports from a couple of source spreadsheets using OpenRefine.

This is just a recasting of the approach demonstrated in the Writing Each Row… post, and more fully described in this IPython notebook, so even if you don’t understand Python, it’s probably worth reviewing those just to get a feeling of the steps involved.

To start with, let’s see how we might generate a basic template from the complaints CSV file, loaded in with the setting to parse numerical columns as such.

OpenRefine

The default template looks something like this:

default template

We can see how each the template provides a header slot, for the start of the output, a template applied to each row, a separator to spilt the rows, and a footer.

The jsonize function makes sure the output is suitable for output as a JSON file. We just want to generate text so we can forget that.

Here’s the start of a simple report…

Report for {{cells["Practice_Code"].value}} ({{cells["Year"].value}}):

  Total number of written complaints received:
  - by area: {{cells["Total number of written complaints received"].value}} (of which, {{cells["Total number of written 
complaints upheld"].value}} upheld)
  - by subject: {{cells["Total number of written complaints received 2"].value}} (of which, {{cells["Total number of written 
complaints upheld 2"].value}} upheld)

custom_export _start

The double braces ({{ }} allow you to access GREL statements. Outside the braces, the content is treated as text.

Note that the custom template doesn’t get saved… I tend to write the custom templates in a text editor, then copy and paste them into OpenRefine.

We can also customise the template with some additional logic using the if(CONDITION, TRUE_ACTION, FALSE_ACTION) construction. For example, we might flag a warning that a lot of complaints were upheld:

openrefine template warning

The original demonstration pulled in additional administrative information (practice name and address, for example) from another source spreadsheet. Merging Datasets with Common Columns in Google Refine describes a recipe for merging in data from another dataset. In this case, if our source is the epraccur spreadsheet, we can create an OpenRefine project from the epraccur spreadsheet (use no lines as the header – it doesn’t have a header row) and then merge in data from the epraccur project into the complaints project using the practice code (Column 1 in the epraccur project) as the key column used to add an additional practice name column based on the Practice_Code column in the complaints project – cell.cross("epraccur xls", "Column 1").cells["Column 2"].value[0]

Note that columns can only be merged in one column at a time.

In order to filter the rows so we can generate reports for just the Isle of Wight, we also need to merge in the Parent Organisation Code (Column 15) from the epraccur project. To get Isle of Wight practices, we could then filter on code 10L. If we then used out custom exporter template, we could get just textual reports for the rows corresponding to Isle of Wight GP practices.

nhs openrefine filter

Teasing things apart a bit, we also start to get a feel for a more general process. Firstly, we can create a custom export template to generate a textual representation of each row in a dataset. Secondly, we can use OpenRefine’s filtering tools to select which rows we want to generate reports from, and order them appropriately. Thirdly, we could also generate new columns containing “red flags” or news signals associated with particular rows, and produce a weighted sum column on which to rank items in terms of newsworthiness. We might also want to merge in additional data columns from other sources, and add elements from those in to the template. Finally, we might start to refine the export template further to include additional logic and customisation of the news release output.

See also Putting Points on Maps Using GeoJSON Created by Open Refine for a demo of how to generate a geojson file using the OpenRefine custom template exporter as part of a route to getting points onto a map.