Just before the break, I came across a rather entrancing visualisation of Jean Michel Jarre’s Oxygene album in the form of an animated spectrogram [video].
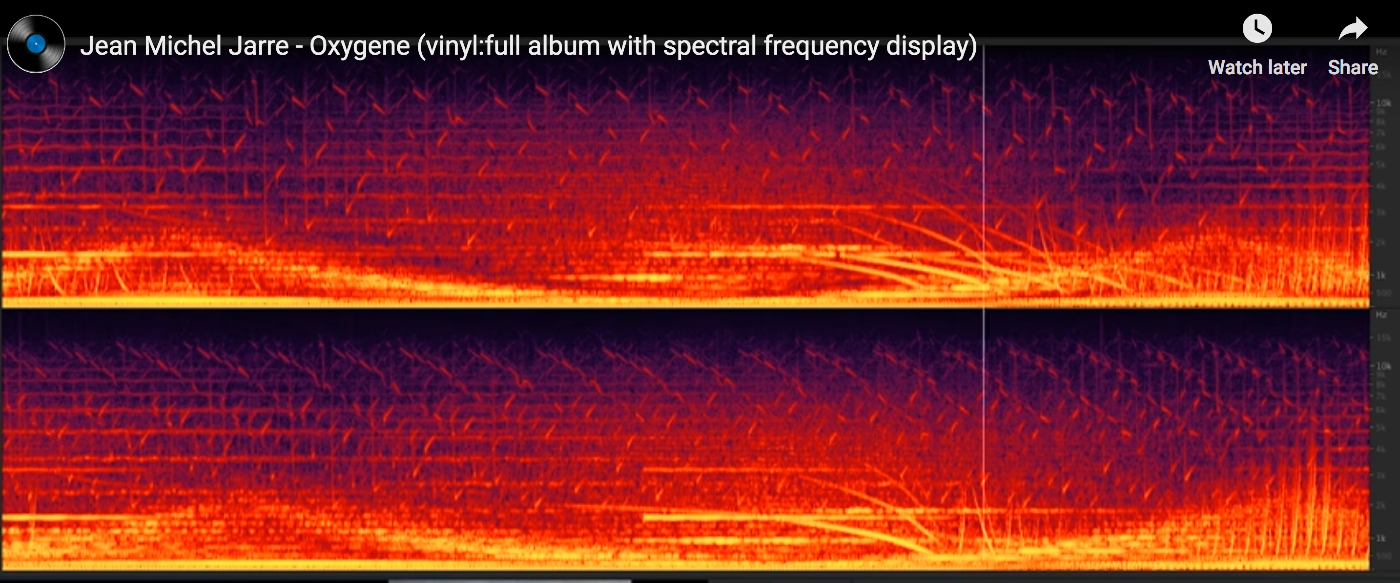 Time is along the horizontal x-axis, and frequency along the vertical y-axis. The bright colours show the presence, and volume, of each frequency as the track plays out.
Such visualisations can help you hear-by-seeing the structure of the sound as the music plays. So I wondered… could I get something like that working in a Jupyter notebook….?
And it seems I can, using the rather handy jp_proxy_widget that provides a way of easily loading jQueryUI components as well as the requests.js module to load and run Javascript widgets.
Via this StackOverflow answer, which shows how to embed a simple audio visualisation into a Jupyter notebook using the Wavesurfer.js package, I note that Wavesurfer.js also supports spectrograms. The example page docs are a bit ropey, but a look at the source code and the plugin docs revealed what I needed to know…
#%pip install --upgrade ipywidgets
#!jupyter nbextension enable --py widgetsnbextension

#%pip install jp_proxy_widget

import jp_proxy_widget

widget = jp_proxy_widget.JSProxyWidget()

js = "https://unpkg.com/wavesurfer.js"
js2="https://unpkg.com/wavesurfer.js/dist/plugin/wavesurfer.spectrogram.min.js"
url = "https://ia902606.us.archive.org/35/items/shortpoetry_047_librivox/song_cjrg_teasdale_64kb.mp3"

widget.load_js_files([js, js2])

widget.js_init("""
element.empty();

element.wavesurfer = WaveSurfer.create({
    container: element[0],
    waveColor: 'violet',
        progressColor: 'purple',
        loaderColor: 'purple',
        cursorColor: 'navy',
        minPxPerSec: 100,
        scrollParent: true,
        plugins: [
        WaveSurfer.spectrogram.create({
            wavesurfer: element.wavesurfer,
            container: element[0],
            fftSamples:512,
            labels: true
        })
    ]
});

element.wavesurfer.load(url);

element.wavesurfer.on('ready', function () {
    element.wavesurfer.play();
});
""", url=url)

widget

#It would probably make sense to wire up these commands to upywidgets buttons...
#widget.element.wavesurfer.pause()
#widget.element.wavesurfer.play(0)
The code is also saved as a gist here and can be run on MyBinder (the dependencies should be automatically installed): ![]()
Here’s what it looks like (It may take a moment or two to load when you run the code cell…)
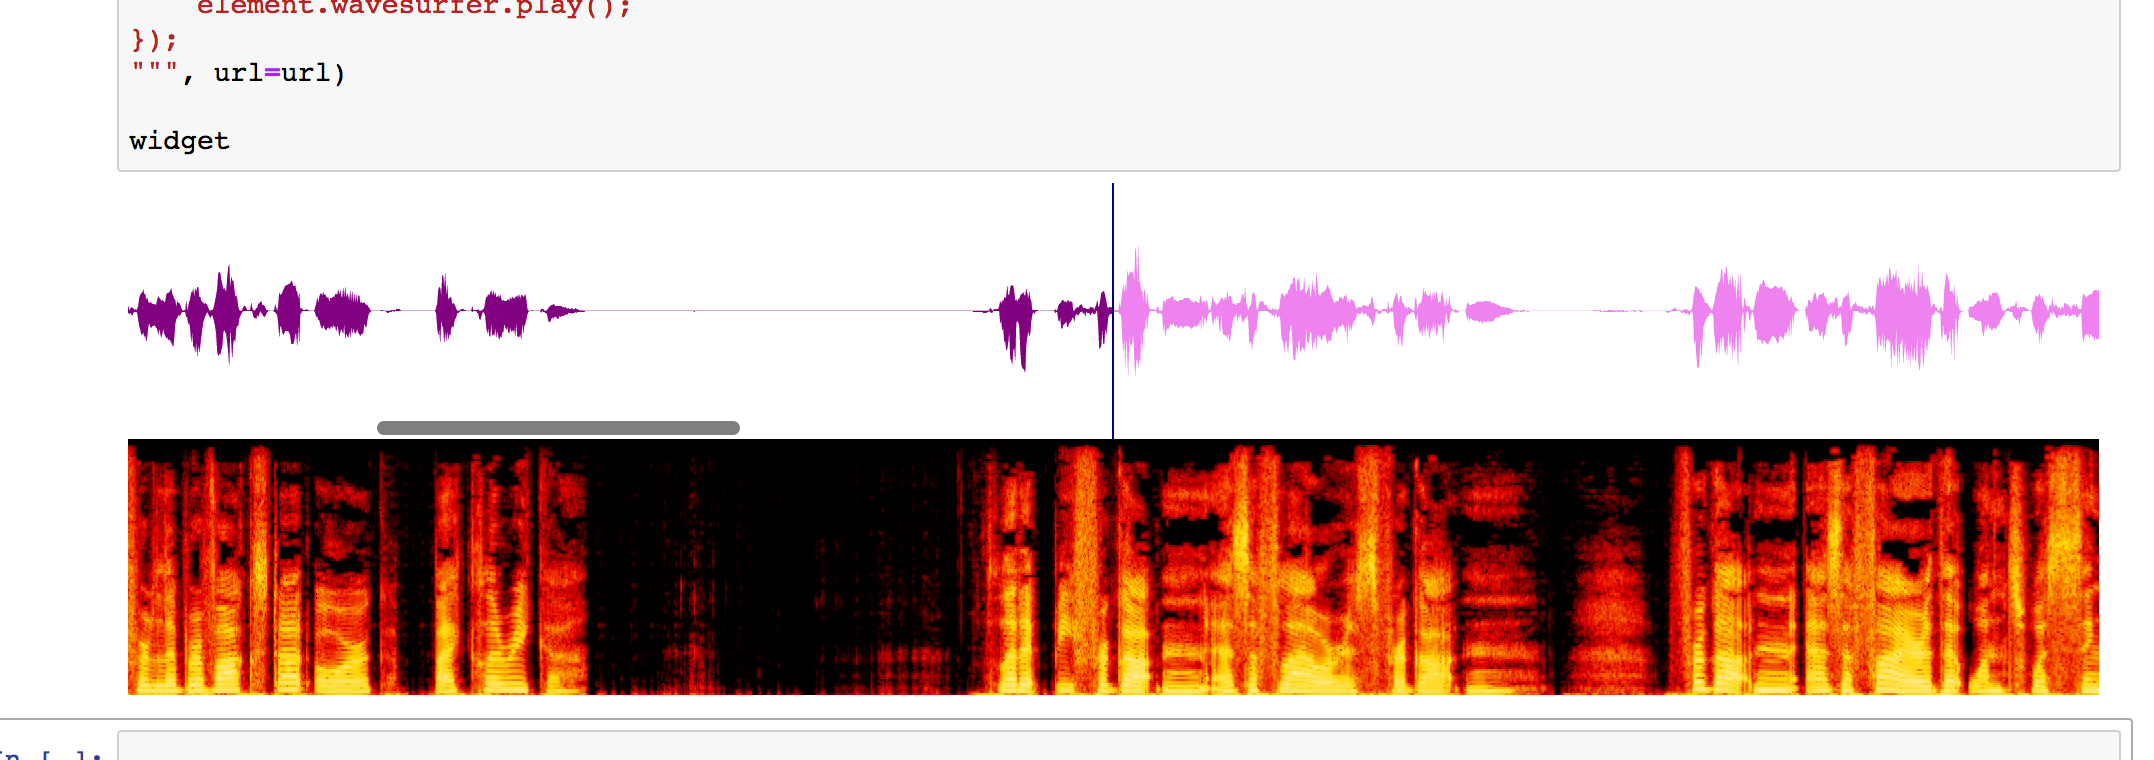
It doesn’t seem to work in JupyterLab though… [UPDATE: following recent patches to jp_proxy_widget, it may well work now…]
It looks like the full ipywidgets machinery is supported, so we can issue start and stop commands from the Python notebook envioronment that control the widget Javascript.
So now I’m wondering what other Javascript apps are out there that might be interesting in a Jupyter notebook context, and how easy it’d be to get them running…?
It might also be interesting to try to construct an audio file within the notebook and then visualise it using the widget.
PS ipywidget slider corss-referencing wavesurfer.js playhead: https://gist.github.com/scottire/654019e88e6225c15a68006ab4a3ba98 h/t @_ScottCondron
PPS and more from Scott Condron, showing how to wire up holoviews sliders, a spectrogram and an audio player: interactive audio plots in jupyter notebooks

Thanks for doing this! I think the issue with JupyterLab may be that the JupyterLab Javascript bundle must be rebuilt to install the proxy widget module. I pasted your code into my installation and it worked for me (Mac/Chrome/JupyterLab) — but I had installed the proxy widgets module using the command line before starting JupyterLab.
Ah, ok, will maybe have another try… I just don’t get JupyterLab.. it’s too complicated ;-)
(What I was wondering was whether I’d be able to tear off the widget display into it’s own JupyterLab panel? Next step then would be to start putting some widget buttons together to control the player, and perhaps a drop to to load in audio files. I also pondered a simple widget driven signal generator that I could use to generate simple audio files and then see what they look like in the spectrogram widget…)