In passing, I note ggalt, an R package containing some handy off-the-shelf geoms for use with ggplot2.
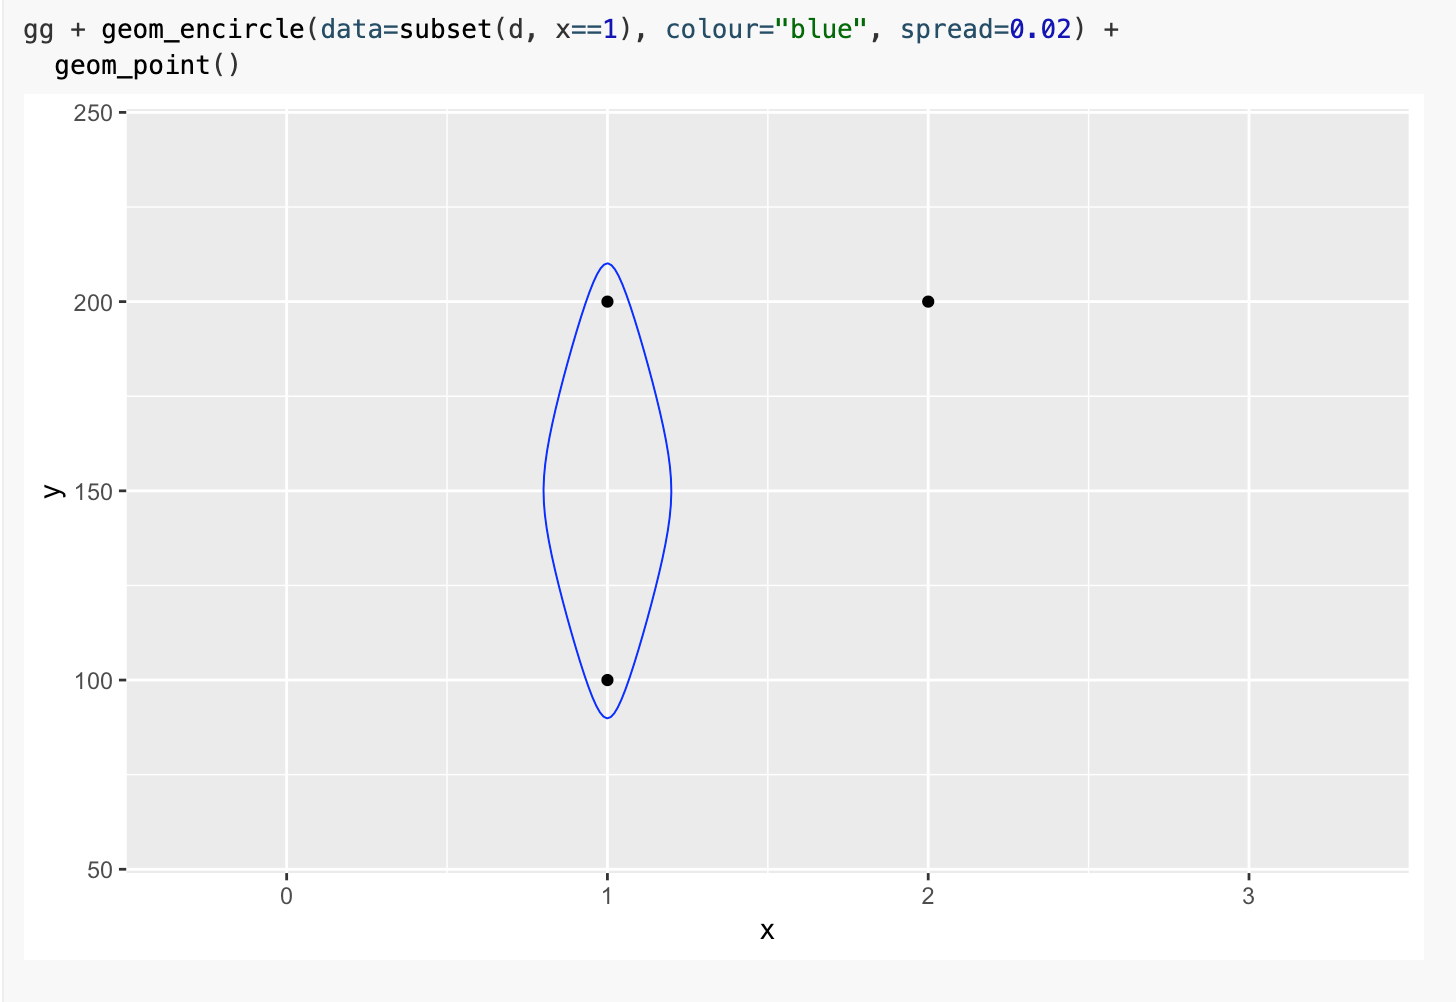
Using geom_encircle() you can trivially encircle a set of points which could be really handing when demonstrating / highlighting grouping various sets of points in a scatterplot:
See the end of this post for a recipe for creating a similar effect in Python.
You can also encircle and fill by group:

A lollipop chart . The geom_lollipop() geom provides a clean alternative to the bar chart (although with a possible loss of resolution around the actual value being indicated):

A dumbbell chart provides a really handy way of comparing differences between pairs of values. Enter, the geom_dumbbell():

The geom_dumbbell() will also do dodging of duplicate treatment values, which could be really useful:

The geom_xspline() geom provides a good range of controls for generating splines drawn relative to control points: “for each control point, the line may pass through (interpolate) the control point or it may only approach (approximate) the control point”.

The geom_encircle() idea is really handy for annotating charts. I donlt think there’s a native Pyhton seaborn method for this, but there is a hack to it (via this StackOverflow answer) using the scipy.spatial.ConvexHull() function:
# Via: https://stackoverflow.com/a/44577682

import matplotlib.pyplot as plt
import numpy as np; np.random.seed(1)
from scipy.spatial import ConvexHull

x1, y1 = np.random.normal(loc=5, scale=2, size=(2,15))
x2, y2 = np.random.normal(loc=8, scale=2.5, size=(2,13))

plt.scatter(x1, y1)
plt.scatter(x2, y2)

def encircle(x,y, ax=None, **kw):
    if not ax: ax=plt.gca()
    p = np.c_[x,y]
    hull = ConvexHull(p)
    poly = plt.Polygon(p[hull.vertices,:], **kw)
    ax.add_patch(poly)

encircle(x1, y1, ec="k", fc="gold", alpha=0.2)
encircle(x2, y2, ec="orange", fc="none")

plt.show()

It would be handy to add a buffer / margin region so the line encircles the points rather than going through the envelope loci? From this handy post on Drawing Boundaries in Python, one way of doing this is to cast the points defining the convex hull to a shapely shape (eg using boundary = shapely.geometry.MultiLineString(edge_points)) and then buffer it using a shapely shape buffer (boundary.buffer(1)). Alternatively, if the points are cast as shapely points using MultiPoint, then shapely also a convex hull function that returns and object that can be buffered from directly.
