Wrangling F1 Data With R – F1DataJunkie Book

Earlier this year I started trying to pull together some of my #f1datajunkie R-related ramblings together in a book form. The project stalled, but to try to reboot it I’ve started publishing it as a living book over on Leanpub. Several of the chapters are incomplete – with TO DO items sketched in, others are still unpublished. The beauty of the Leanpub model is that if you buy a copy, you continue to get access to all future updated versions of the book. (And my idea is that by getting the book out there as it is, I’ll feel as if there’s more (social) pressure on actually trying to keep up with it…)

I’ll be posting more details about how the Leanpub process works (for me at least) in the next week or two, but for now, here’s a link to the book: Wrangling F1 Data With R: A Data Junkie’s Guide.

Here’s the table of contents so far:

  • Foreword
    • A Note on the Data Sources
  • Introduction
    • Preamble
    • What are we trying to do with the data?
    • Choosing the tools
    • The Data Sources
    • Getting the Data into RStudio
    • Example F1 Stats Sites
    • How to Use This Book
    • The Rest of This Book…
  • An Introduction to RStudio and R dataframes
    • Getting Started with RStudio
    • Getting Started with R
    • Summary
  • Getting the data from the Ergast Motor Racing Database API
    • Accessing Data from the ergast API
    • Summary
  • Getting the data from the Ergast Motor Racing Database Download
    • Accessing SQLite from R
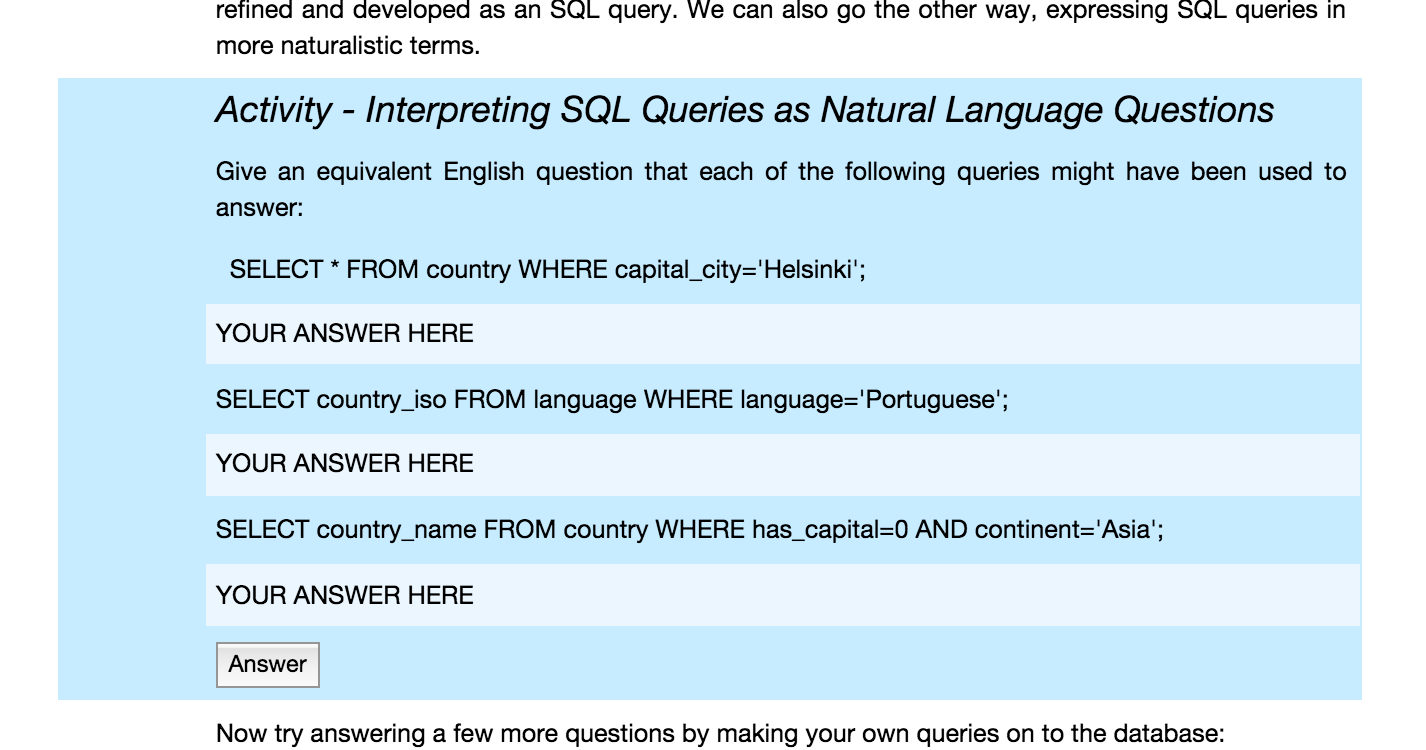
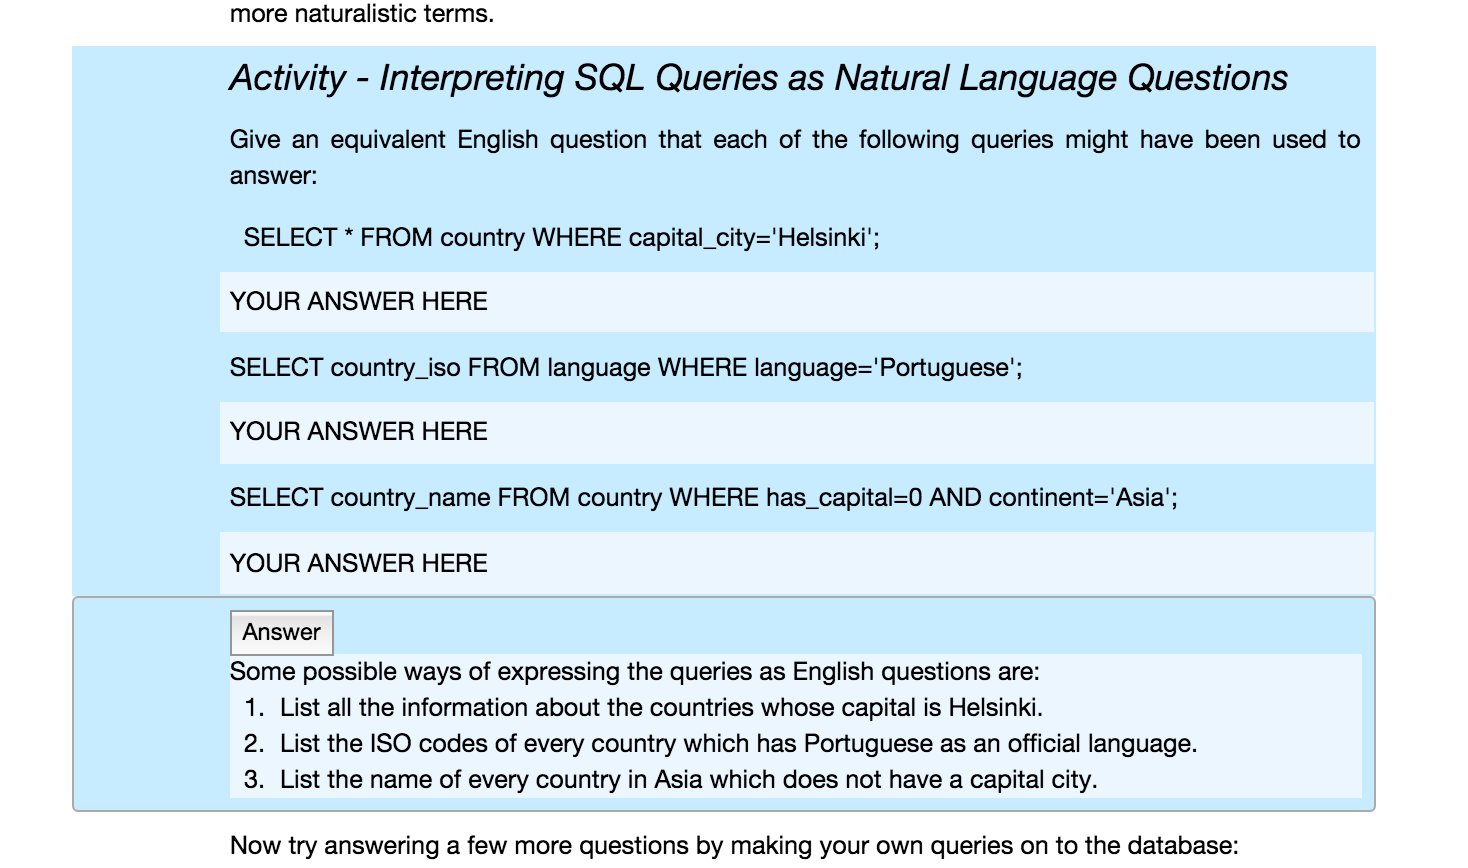
    • Asking Questions of the ergast Data
    • Summary
    • Exercises and TO DO
  • Data Scraped from the F1 Website
    • Problems with the Formula One Data
    • How to use the FormulaOne.com alongside the ergast data
  • Reviewing the Practice Sessions
    • The Weekend Starts Here
    • Practice Session Data from the FIA
    • Sector Times
    • FIA Media Centre Timing Sheets
  • A Quick Look at Qualifying
    • Qualifying Session Position Summary Chart
    • Another Look at the Session Tables
    • Ultimate Lap Positions
  • Lapcharts
    • Annotated Lapcharts
  • Race History Charts
    • The Simple Laptime Chart
    • Accumulated Laptimes
    • Gap to Leader Charts
    • The Lapalyzer Session Gap
    • Eventually: The Race History Chart
  • Pit Stop Analysis
    • Pit Stop Data
    • Total pit time per race
    • Pit Stops Over Time
    • Estimating pit loss time
    • Tyre Change Data
  • Career Trajectory
    • The Effect of Age on Performance
    • Statistical Models of Career Trajectories
    • The Age-Productivity Gradient
    • Summary
  • Streakiness
    • Spotting Runs
    • Generating Streak Reports
    • Streak Maps
    • Team Streaks
    • Time to N’th Win
    • TO DO
    • Summary
  • Conclusion
  • Appendix One – Scraping formula1.com Timing Data
  • Appendix Two – FIA Timing Sheets
    • Downloading the FIA timing sheets for a particular race
  • Appendix – Converting the ergast Database to SQLite

If you think you deserve a free copy, let me know… ;-)

More Tukey Gems

Via a half quote by Adam Cooper in his SoLAR flare talk today, elucidated in his blog post Exploratory Data Analysis, I am led to a talk by John Tukey – The Technical Tools of Statistics – read at the 125th Anniversary Meeting of the American Statistical Association, Boston, November 1964.

As ever (see, for example, Quoting Tukey on Visual Storytelling with Data), it contains some gems… The following is a spoiler of the joy of reading the paper itself. I suggest you do that instead – you’ll more than likely find your own gems in the text: The Technical Tools of Statistics.

If you’re too lazy to click away, here are some of the quotes and phrases I particularly enjoyed.

To start with, the quote referenced by Adam:

Some of my friends felt that I should be very explicit in warning you of how much time and money can be wasted on computing, how much clarity and insight can be lost in great stacks of computer output. In fact, I ask you to remember only two points:

  • The tool that is so dull that you cannot cut yourself on it is not likely to be sharp enough to be either useful or helpful.
  • Most uses of the classical tools of statistics have been, are, and will be, made by those who know not what they do.

And here’s one I’m going to use when talking about writing diagrams:

Hand-drawing of graphs, except perhaps for reproduction in books and in some journals, is now economically wasteful, slow, and on the way out.

(It strikes me that using a spreadsheet wizard to create charts in a research or production setting, where we are working in a reproducible, document generation context, is akin to the “hand-drwaing of graphs” of yesteryear?)

“I know of no person or group that is taking nearly adequate advantage of the graphical potentialities of the computer.”

Nothing’s changed?!

[W]e are going to reach a position we should have reached long ago. We are going, if I have to build it myself, to have a programming system — a “language” if you like — with all that that implies, suited to the needs of data analysis. This will be planned to handle numbers in organized patterns of very different shapes, to apply a wide variety of data-analytical operations to make new patterns from old, to carry out the oddest sequences of apparently unrelated operations, to provide a wide variety of outputs, to automatically store all time-expensive intermediate results “on disk” until the user decides whether or not he will want to do something else with them, and to do all this and much more easily.

Since I’ve started playing with pandas, my ability to have written conversations with data has improved. Returning to R after a few months away, I’m also finding that easier to write as well (the tabular data models, and elements of the syntax, are broadly similar across the two).

Most of the technical tools of the future statistician will bear the stamp of computer manufacture, and will be used in a computer. We will be remiss in our duty to our students if we do not see that they learn to use the computer more easily, flexibly, and thoroughly than we ever have; we will be remiss in our duties to ourselves if we do not try to improve and broaden our own uses.

This does not mean that we shall have to continue to teach our students the elements of computer programming; most of the class of ’70 is going to learn that as freshmen or sophomores. Nor does it mean that each student will write his own program for analysis of variance or for seasonal adjustment, this would be a waste. … It must mean learning to put together, effectively and easily — on a program-self-modifying computer and by means of the most helpful software then available — data analytical steps appropriate to the need, whether this is to uncover an anticipated specific appearance or to explore some broad area for unanticipated, illuminating appearances, or, as is more likely, to do both.

Interesting to note that in the UK, “text-based programming” has made it into the curriculum. (Related: Text Based Programming, One Line at a Time (short course pitch).)

Tukey also talks about how computing will offer flexibility and fluidity. Flexibility includes the “freedom to introduce new approaches; freedom, in a word, to be a journeyman carpenter of data-analytical tools”. Fluidity “means that we are prepared to use structures of analysis that can flow rather freely … to fit the apparent desires of the data”.

As the computer revolution finally penetrates into the technical tools of statistics, it will not change the essential characteristics of these tools, no matter how much it changes their appearance, scope, appositeness and economy. We can only look for:

  • more of the essential erector-set character of data analysis techniques, in which a kit of pieces are available for assembly into any of a multitude of analytical schemes,
  • an increasing swing toward a greater emphasis on graphicality and informality of inference,
  • a greater and greater role for, graphical techniques as aids to exploration and incisiveness,
  • steadily increasing emphasis on flexibility and on fluidity,
  • wider and deeper use of empirical inquiry, of actual trials on potentially interesting data, as a way to discover new analytic techniques,
  • greater emphasis on parsimony of representation and inquiry, on the focussing, in each individual analysis, of most of our attention on relatively specific questions, usually in combination with a broader spreading of the remainder of our attention to the exploration of more diverse possibilities.

In order that our tools, and their uses, develop effectively … we shall have to give still more attention to doing the approximately right, rather than the exactly wrong, …

All quotes from John Tukey, The Technical Tools of Statistics, 1964.

Wonderful:-)

A Loss of Sovereignty?

Over the course of the weekend, rummaging through old boxes of books as part of a loft clearout, I came across more than a few OU textbooks and course books. Way back when, OU course materials were largely distributed in the form of print items and hard media – audio and video cassettes, CD- and DVD-ROMs and so on. Copies of the course materials could be found in college and university libraries that acted as OU study centres, via the second hand market, or in some cases purchased from the OU via OU Worldwide.

Via an OU press release out today, I notice that “[c]ourse books from The Open University (OU) have been donated to an educational sponsorship charity in Kenya, giving old course books a new use for the local communities.” Good stuff…

..but it highlights an issue about the accessibility of our materials as they increasingly move to digital form. More and more courses deliver more and more content to students via the VLE. Students retain access to online course materials and course environments for a period of time after a module finishes, but open access is not available.

True, many courses now release some content onto OpenLearn, the OU’s free open learning platform. And the OU also offers courses on the FutureLearn platform (an Open University owned company that made some share allotments earlier this year).

But access to the electronic form is not tangible – the materials are not persistent, the course materials not tradeable. They can’t really be owned.

I’m reminded of a noticing I had earlier this week about our Now TV box that lets us watch BBC iPlayer, 4oD, youTube and so on via the telly. The UI is based around a “My subscriptions” model which shows the channels (or apps) you subscribe to. Only, there are some channels in their that I didn’t subscribe to, and that – unlike the channels I did subscribe to – I can’t delete from my subscriptions. Sky – I’m looking at you. (Now TV is a Sky/BSkyB product.)

In a similar vein, Apple and U2 recently teamed together to dump a version of U2’s latest album into folks’ iTunes accounts, “giving away music before it can flop, in an effort to stay huge” as Iggy Pop put it in his John Peel Lecture [on BBC iPlayer], and demonstrating once again that our “personal” areas on these commercial services are no such thing. We do not have sovereignty over them. Apple is no Sir Gawain. We do not own the things that are in our collections on these services and nor do we own the collection: I doubt you hold a database right in any collection you curate on youtube or in iTunes, even if you do expend considerable time, effort and skill in putting that collection together; and I fully imagine that the value of those collections as databases are exploited by the recommendation engine mining tools the platform services operate.

And just as platform operators can add things to out collections, so too can they take them away. Take Amazon, for example, who complement their model of selling books with one of renting you limited access to ebooks via their Kindle platform. As history shows – Amazon wipes customer’s Kindle and deletes account with no explanation or The original Big Brother is watching you on Amazon Kindle – Amazon is often well within its rights, and it is well within its capacity, to remove books from your device whenever it likes.

In the same way that corporate IT can remotely manage “your” work devices using enterprise mobile device management (Blackberry: MDM and beyond, Goole apps: mobile management overview, Apple: iOS and the new IT, for example), so too can platform operators of devices – and services – reach into your devices – or service clients – and poke around inside them. Unless we’ve reclaimed it as our own, we’re all users of enterprise technology masked as consumer offerings and have ceded control over our services and devices to the providers of them.

The loss of sovereignty also extends to the way in which devices and services are packaged so that we can’t look inside them, need special tools to access them, can’t take ownership of them in order to appropriate them for other purposes. We are users in a pejorative sense; and we are used by service and platform providers as part of their business models.

Isle of Wight Ferries – Adjournment Debate

Island MP Andrew Turner (Con) secured an adjournment debate last night on the Isle of Wight Ferries. As with airlines, Wightlink (I’m not sure about Red Funnel?) appear to operate dynamic pricing (their strapline: “flexi-Pricing… matching demand with capacity”), upping the cost of ferry tickets to match demand. Residents’ multilink tickets (books of tickets bought in advance at a discounted price – currently, a return trip, off a book of 10 returns by car, costs me about £43 on the boat) don’t guarantee a sailing: residents’ places appear to be subject to quota).

The ferry companies are leveraged by private debt, which acts as a brake on investment and an inflator of ticket prices. In recent years, the number of sailings has reduced – making convenient travel difficult at times, more so when resident ticket quotas are applied to sailings – presumably in order to reduce operating costs.

The unreliability (from my experience) of rail connections provided between London and Portsmouth, along with reduced late night sailings, means that day trips to London require a very early evening departure from London in order to guarantee making a passenger boat. Start of the day London meetings require a very early start; important early start meetings require travel up to London the day before.

Both the cost and inconvenience of sailing (not only limited sailings: a one-way crossing of the Solent by car ferry takes about an hour when booking in, loading, crossing, and disembarkation are taken into account) factor into personal decisions I now make about leaving and returning to the Island in a detrimental way on many levels.

List Brokerage – Putting Data About You to Work…

Not ever having worked in the marketing world, whenever I do stumble across the presumably everyday dealings of marketers of advertisers I am reminded about how incredibly naive I am about it all.

So for example, today I came across Media-Arrow, a direct marketing and list brokering company. Here’s an example of some of the lists they advertise access to:

  • Adults Only: almost 50,000 buyers over the last year of “a wide range for adult products including toys, DVD’s, videos, magazines, clothing, etc. via mail order or through the company’s shops”. So they buy the data from a particular company? And over 50,000 “Active Enquirers” (“catalogue and product information requesters, web based or coupon based requests”) over the last year, with verified names and addresses.
  • Affluent Grey Britain: over 650,000 “affluent over 55’s” and almost 50,000 age selectable e-mail addresses. The database “has been specifically built with affluence in mind and the profiles used provide clear targeting to this lucrative, wealthy and financially astute market. These consumers have high disposable income, good credit rating and live in identifiable high-valuable properties – identified by list owner’s Property Watcher data. Exclusively homeowners…” So someone’s keeping track of house prices and ownership as part of the value-add associated with this list?
  • Award Productions: over 80,000 mail order buyers, typically ex-servicemen and women medal holders and buyers of related commemorative products”. This list looks like it could be the customer list of http://www.awardmedals.com/ ?
  • Big Book Default: over 700,000 contacts with dates of birth and selectable names. “This specialised credit file identifies prospects who demonstrate an active willingness to take out additional borrowing. All have made some payments to major catalogue companies, credit cards or utilities but have subsequently defaulted. … The entire list is deliberately overlaid with a home-owner tag, ensuring that secured lending can be effectively marketed.” So folk who are happy to take on debt, and then default, and may have something to secure it against? Wonga fodder?
  • Britains Movers: “homeowner movers is drawn from a high volume data pool. The file is updated weekly from Land Registry and Utility Company data”. Why do you think corporates keep lobbying for open public data?
  • Charity Superstore: “over 900,000 charity donators that have been sourced through transactional data systems which capture the details of live supporters of various charitable causes”. Because giving isn’t enough; and selling you on doesn’t really cost you anything more, does it?
  • Cotswold Collections: “a much sought after mail order catalogue”, apparently, that also sells almost 15,000 customer records on?
  • Cottage Garden: “a ‘fast-growing’ file of Mail Order Buyers of gardening & gift offers for the keen amateur gardener. … Buyers are recruited from National newspaper adverts, Offers & Inserts”. So the next time you fall for a mail-order ad via your favourite newspaper, remember that the price is so low because the product is actually you…
  • Credit Seekers: “Built specifically from mail order catalogue buyers data, this segment accurately targets lower income households experiencing some cash flow issues.” Because they don’t know any better and you can rip them off some more…
  • Director Select: “select file of Directors at home, built primarily from Companies House data, has 900,000+ named company directors at home address.” Why do you think corporates keep lobbying for open public data?
  • Educating Britain: “The file include the names of nearly 500,000 people who have bought or are buying distance learning courses in the last 12 months”. Hmm…
  • Pet ID: “the Pet-ID file includes people who have had their pets micro-chipped in case of loss or theft”. Because a dog’s not just for Christmas, it’s also for data.
  • Pet ID – Horse Owners: “one of UK’s official Horse Passport Issuers … UK legislation, now requires all horse owners to obtain ‘passport’ papers for their horses.” A handy UK gov spinoff: driving the data economy.

And here are the rest of the lists, by name…: Book Buyers, Communication Avenue, Dukeshill, Empty Nest High Fliers, Executive Suite, Family Britain, Fast & Furious, Financial Britain, Gambling Britain, Home Improvers, Industrial Claims File, Krystal Communication, Mail Order Superstore, Monied Ladies, Mont Rose of Guernsey, Older & Wiser, Over 65′s, Pashmina Bazaar, PDSA Lottery, Pet House, Pet People, Pet Solutions, Prize Magazines Responders, Prosperity File, Prudent Savers, Retail Therapy, Salesfeed, Six Channels – B2B File, SixChannels – B2B file Worldwide, SixChannels – B2C File, SixChannels – Consumer-Business Selects, TDS Insurance File, The Pottery File, The Rich List, Totally Professional, Wealthy Database.

I’m not sure how the list brokerage actually works? I assume the purchaser doesn’t get the list, they just get access to the list, and provide the broker with the thing they want mailing out? But does the broker have access to the lists, and are they data controllers of their contents? If so, I should be able to make a Data Protection Act subject access request of them to find out which lists I’m on and what information each of them has about me?

See also: Demographically Classed, which lists the segments used in the ACORN and MOSAIC geodemographic segmentation schemes.

Summary Notes of Data Conversations Around PFI Data

As I briefly mentioned in a previous post, a few weeks ago I came across a spreadsheet summarising awarded PFI contracts as of 2013 (private finance initiative projects, 2013 summary data). At the time, I put together a couple of quick notebooks exploring the data. This data is a summary post/note to self about what’s in those notebooks.

As background to what PFI actually is, the Commons Treasury Select committee published this report on the Private Finance Initiative in July, 2011. It describes PFI as follows:

In a typical PFI project, the private sector party is constituted as a Special Purpose Vehicle (SPV), which manages and finances the design, build and operation of a new facility. The financing of the initial capital investment (i.e. the capital required to pay transaction costs, buy land and build the infrastructure) is provided by a combination of share capital and loan stock from the owners of the SPV, together with senior debt from banks or bond-holders. The return on both equity and debt capital is sourced from the periodic “unitary charge”, which is paid by the public authority from the point at which the contracted facility is available for use. The unitary charge may be reduced (to a limited degree) in certain circumstances: e.g. if there is a delay in construction, if the contracted facility is not fully operational, or if services fail to meet contracted standards. Thus, the PFI structure is designed to transfer project risks from the public to the private sector.

The document A new approach to public private partnerships, HM Treasury, December 2012 clarifies that “the public sector does not pay for the project’s capital costs over the construction period. Once the project is operational and is performing to the required standard, the public sector pays a unitary charge which includes payments for ongoing maintenance of the asset, as well as repayment of, and interest on, debt used to finance the capital costs. The unitary charge, therefore, represents the whole life cost associated with the asset.”

A brief critique of PFI in the context of the health service can be found in The private finance initiative PFI in the NHS — is there an economic case? by Declan Gaffney, Allyson M Pollock, David Price and Jean Shaoul.

The PFI summary data table itemises historical unitary charge payments associated with a particular project on a financial year basis (eg ‘Unitary charge payment 1992-93 (£m)’) as well as projected unitary charges (eg ‘Estimated unitary charge payment 2015-16 (£m)’). An amount is also given for the Capital Value (£m) of the project.

The first notebook – Quick Look at UK PFI Contracts Data – identifies all the columns available in the spreadsheet.

For example, separate columns identify whether a project is ‘On / Off balance sheet under IFRS’, ‘On / Off balance sheet under ESA 95’, or ‘On / Off balance sheet under UK GAAP’. According to the New Approach document:

Departments have separate budgets for resource and capital spending. Resource spending (RDEL) includes current expenditure such as pay or procurement. Capital spending (CDEL) includes new investment. The scoring of the project in departmental budgets depends on whether the project is classified as on or off balance sheet under ESA95.

1.12 If a central government project is deemed to be on balance sheet under ESA95, then the capital value of the project (i.e. the debt required to undertake the project) is recorded as CDEL in the first year of operation; and the interest, service and depreciation are recorded as RDEL each year unitary charges are paid.

1.13 If a central government project is deemed to be off balance sheet under ESA95, then there is no impact on the department’s CDEL in the first year of operation. The full unitary charge (including interest, service and debt repayment) does, however, score in RDEL each year. Around 85 per cent of past PFI projects have been considered off-balance sheet under ESA95.

The notebook includes summary calculations such as the total capital value of projects by sector, as well as time series plots showing the value of unitary charge payments over time (both in total and for particular procuring authorities or department.

pfi_unitaryCharge_by_authority

The spreadsheet also contains information about equity partners. We can use this to report on the projects that a particular company is involved with.

pfi_partners_report

We can also review the unitary payments going to a particular group over time:

pfi_partners_report2

The second notebook – A Quick Thread Pull Around PFI Special Purpose Vehicles – digs around the PFI project SPVs (special purpose vehicles) a little more, using data from OpenCorporates.

One question explored in the notebook is whether or not the set of directors for a particular SPV also act as the set of directors for any other companies. So for example, for the SPV that is Pyramid Schools (Hadley) Ltd, we find several other companies sharing all the same directors:

pfi_spv_pyramidSchools

For Island Roads, we see that several companies appear to have been set up associated with the project. In addition, there are several directors from the Island Roads director list associated with other companies, for example HOUNSLOW HIGHWAYS SERVICES LIMITED or PARTNERS 4 LIFT.

pfi_spv_islandRoads

A search of PFI SPVs identifies Hounslow Highway Services Limited as another PFI company, so the director linkage suggests that one of the partners for the Island Roads project is also a partner of the Hounslow Roads project. In this case, the linkage can also be identified through the equity partners:

pfi_spv_islandRoads_linkage

There is possibly more that could be done to look through the linkage between the PFI SPVs and equity partners, eg on the basis of similarities between directors, or registered addresses. There might also be some mileage in looking at directors who are also directors of companies that make large political donations, for example.

Participatory Surveillance

This is an evocative phrase, I think – “participatory surveillance” – though the definition of it is lacking from the source in which I came across it (Online Social Networking as Participatory Surveillance, Anders Albrechtslund, First Monday, Volume 13, Number 3 – 3 March 2008).

A more recent and perhaps related article – Cohen, Julie E., The Surveillance-Innovation Complex: The Irony of the Participatory Turn (June 19, 2014). In Darin Barney, Gabriella Coleman, Christine Ross, Jonathan Sterne & Tamar Tembeck, eds., The Participatory Condition (University of Minnesota Press, 2015, Forthcoming) – notes how “[c]ontemporary networked surveillance practices implicate multiple forms of participation, many of which are highly organized and strategic”, and include the “crowd-sourcing of commercial surveillance”. It’s a paper I need to read and digest properly…

One example from the last week or two of a technology that supports particapatory surveillance comes from Buzzfeed’s misleading story relating how Hundreds Of Devices [Are] Hidden Inside New York City Phone Booths that “can push you ads — and help track your every move”; (the story resulted in the beacons being removed). My understanding of beacons is that they are a Bluetooth push technology that emit a unique location code, or a marketing message, within a limited range. A listening device can detect the beacon message and do something with it. The user thus needs to participate in any surveillance activity that makes use of the beacon by listening out for a beacon, capturing any message it hears, and then doing something with that message (such as phoning home with the beacon message).

The technology described in the Buzzfeed story is developed by Gimbal, who offer an API, so it should be possible to get a feel from that what is actually possible. From a quick skim of the documentation, I don’t get the impression that the beacon device itself listens out for and tracks/logs devices that come into range of it? (See also Postscapes – Bluetooth Beacon Handbook.)

Of course, participating in beacon mediated transactions could be done unwittingly or surreptitiously. Again, my understanding is that Android devices require you to install an app and grant permissions to it that let it listen out for, and act on, beacon messages, whereas iOS devices have iBeacon listening built in the iOS Location Services*, and you then grant apps permission to use messages that have been detected? This suggests that Apple can hear any beacon you pass within range of?

* Apparently, [i]f [Apple] Location Services is on, your device will periodically send the geo-tagged locations of nearby Wi-Fi hotspots and cell towers in an anonymous and encrypted form to Apple to augment Apple’s crowd-sourced database of Wi-Fi hotspot and cell tower locations. In addition, if you’re traveling (for example, in a car) and Location Services is on, a GPS-enabled iOS device will also periodically send GPS locations and travel speed information in an anonymous and encrypted form to Apple to be used for building up Apple’s crowd-sourced road traffic database. The crowd-sourced location data gathered by Apple doesn’t personally identify you. Apple don’t pay you for that information of course, though they might argue you get a return in kind in the form of better location awareness for your device.

There is also the possibility with any of those apps that you install one for a specific purpose, grant it permissions to use beacons, then the company that developed gets taken over by someone you wouldn’t consciously give the same privileges to… (Whenever you hear about Facebook or Google or Experian or whoever buying a company, it’s always worth considering what data, and what granted permissions, they have just bought ownership of…)

See also: “participatory sensing”Four Billion Little Brothers? Privacy, mobile phones, and ubiquitous data collection, Katie Shilton, University of California, Los Angeles, ACM Queue, 7(7), August 2009 – which “tries to avoid surveillance or coercive sensing by emphasizing individuals’ participation in the sensing process”.

Edtech and IPython Notebooks – Activities and Answer Reveals

A few months ago I posted about an interaction style that I’d been using – and that stopped working – in IPython notebooks: answer reveals.

An issue I raised on the relevant git account account turned up a solution that I’ve finally gotten round to trying out – and extending with a little bit of styling. I’ve also reused chunks from another extension (read only code cells) to help style other sorts of cell.

Before showing where I’m at with the notebooks, here’s where OU online course materials are at the moment.

Teaching text is delivered via the VLE (have a look on OpenLearn for lots of examples). Activities are distinguished from “reading” text by use of a coloured background.

m269_closedAns

The activity requires a student to do something, and then a hidden discussion or anser can be revealed so that the student can check their answer.

m269_ansReveal

(It’s easy to be lazy, of course, and just click the button without really participating in the activity. In print materials, a frictional overhead was added by having answers in the back of the study guide that you would have to turn to. I often wonder whether we need a bit more friction in the browser based material, perhaps a time based one where the button can’t be clicked for x seconds after the button is first seen in the viewport (eg triggered using a test like this jQuery isOnScreen plugin)?!)

I drew on this design style to support the following UI in an IPython notebook:

Here’s a markdown cell in activity style and activity answer style.

M269_-_Python_-_Blue1a

The lighter blue background set into the activity is an invitation for students to type something into those cells. The code cell is identified as such by the code line In [ ] label. Whatever students type into those cells can be executed.

The heading is styled from a div element:

M269_-_Python_-_Blue

If we wanted to a slightly different header background style as in the browser materials, we could perhaps select a notebook heading style and then colour the background differently right across the width of the page. (Bah.. should have thought of that earlier!;-)

Markdown cells can also be styled to prompt students to make a text response (i.e. a response written in markdown, though I guess we could also use raw text cells). I don’t yet have a feeling for how much ownership students will take of notebooks and start to treat them as workbooks?

Answer reveal buttons can also be added in:

M269_-_Python_-_Blue2

Clicking on the Answer button displays the answer.

M269_-_Python_-_Blue3

At the moment, the answer background is the same colour as the invitation for student’s to type something, although I guess we could also interpret as part of the tutor-alongside dialogue, and the lighter signifies expected dialogic responses whether from the student or the “tutor” (i.e. the notebook author).

We might also want to make use of answer buttons after a code completion activity. I haven’t figured out the best way to do this as of yet.

M269_-_Python_-_Blue4

At the moment, the answer button only reveals text – and even then the text needs to be styled as HTML (the markdown parsing doesn’t work:-(

M269_-_Python_-_Blue5

I guess one approach might be to spawn a new code cell containing some code written in to the answer button div. Another might be to populate a code cell following the answer button with the answer code, hiding the cell and disabling it (so it can’t be executed/run), then revealing it when the answer button is clicked? I’m also not sure whether answer code should be runnable or not?

The mechanic for setting the cell state is currently a little clunky. There are two extensions, one for the answer button, one for setting the state other cells, that use different techniques for addressing the cells (and that really need to be rationalised). The extensions run styling automatically when the notebook is started, or when triggered. At the moment, I’m using icons from the orgininal code I “borrowed” – which aren’t ideal!

M269_-_Python_-_Blue0

The cell state setter button toggles selected code cells from activity to not-activity states, and markdown cells from activity-description to activity-student-answer to not-activity. The answer button button adds an answer button at every answer div (even if there’s already an answer button rendered). Both extensions style/annotate restarted notebooks correctly.

The current, hacky, user model I have in mind is that authors have an extended notebook with buttons to set the cell styles, and students have an extended notebook without buttons that just styles the notebook when it’s opened.

FWIW, here’s the gist containing extensions code.

Comments/thoughts appreciated…

Pivot Tables, pandas and IPython Notebooks

For the last few months, I’ve found a home in IPython Notebooks for dabbling with data. IPython notebooks provide a flexible authoring tool for combining text with executable code fragments, as well as the outputs from executing code, such as charts, data tables or automatically generated text reports. We can also embed additional HTML5 content into a notebook, either inline or as an iframe.

With a little judicious use of templates, we can easily take data from a source we are working with in the notebook, and then render a view of it using included components. This makes it easy to use hybrid approaches to working with data in the notebook context. (Note: the use of cell magics also let’s us operate on a data set using different languages in the same notebook – for example, Python and R.)

As an example of a hybrid approach to exploratory data analysis, how about the following?

The data manipulation library I’ve spent most of my time in to date in the notebooks is pandas. pandas is a really powerful tool for wrangling tabular data shapes, including reshaping them and running group reports on them. Among the operations pandas supports are pivot tables. But writing the code can be fiddly, and sometimes you just want an interactive hands on play with the data. IPython Notebooks do support widgets (though I haven’t played with them yet), so I guess I could try to write a simple UI for running different pivot table views over dataset in an interactive fashion.

But if I’m happy with reading the numbers the pivot table table reports as an end product, and don’t need access to the report as data, I can use a third party interactive pivot table widget such as Nicolas Kutchen’s Pivot Table component to work with the data in an interactive fashion.

Pivot_Table_demo

I’ve popped a quick demo of a clunky hacky way of feeding a pivot table widget from a pandas dataframe here: pivot table in IPython Notebook demo. A pandas dataframe is written as an HTML table and embedded in a templated page that generates the pivot table from the the HTML table. This page is saved as an HTML file and then loaded in as an IFrame. (We could add the HTML to an iframe using srcdoc, rather than saving it as a file and loading it back in, but I thought it might be handy to have access to a copy of the file. Also, I’m not sure if all browsers support srcdoc?)

(Note: we could also use the pivot table widget with a subset of a large dataset to generate dummy reports to find the ones we want, and test pandas code against the same subset of data against that output to check the code is generating the table we want, and then deploy the code against the full dataset.)

The pivot table has the data in memory as a hidden HTML table in the pivot table page, so performance may be limited for large datasets. On my machine, it was quite happy working with a month’s spending/transparency data from my local council, and provided a quick way of generating different summary views over the data. (The df dataframe is simply the result of loading in the spending data CSV file as a pandas dataframe – no other processing required. So the pivotTable() function could easily be modified to accept the location of a CSV file, such as a local address or a URL, load the file in automatically into a dataframe, and then render it as a pivot table.)

Pivot_Table_demo2

There’s also limited functionality for tunneling down into the data by filtering it within the chart (reather than having to generate a filtered view of the data that is then baked in as a table to the chart HTML page, for example):

Pivot_Table_demo3

I’ve been dabbling with various other embedded charts too which I’ll post when I get a chance.