Converting Spreadsheet Rows to Text Based Summary Reports Using OpenRefine

In Writing Each Row of a Spreadsheet as a Press Release? I demonstrated how we could generate a simple textual report template that could “textualise” separate rows of a spreadsheet. This template could be applied to each row from a subset of rows to to produce a simple human readable view of the data contained in each of those rows. I picked up on the elements of this post in Robot Journalists or Robot Press Secretaries?, where I reinforced the idea that such an approach was of a similar kind to the approach used in mail merge strategies supported by many office suites.

It also struck me that we could use OpenRefine’s custom template export option to generate a similar sort of report. So in this post I’ll describe a simple recipe for recreating the NHS Complaints review reports from a couple of source spreadsheets using OpenRefine.

This is just a recasting of the approach demonstrated in the Writing Each Row… post, and more fully described in this IPython notebook, so even if you don’t understand Python, it’s probably worth reviewing those just to get a feeling of the steps involved.

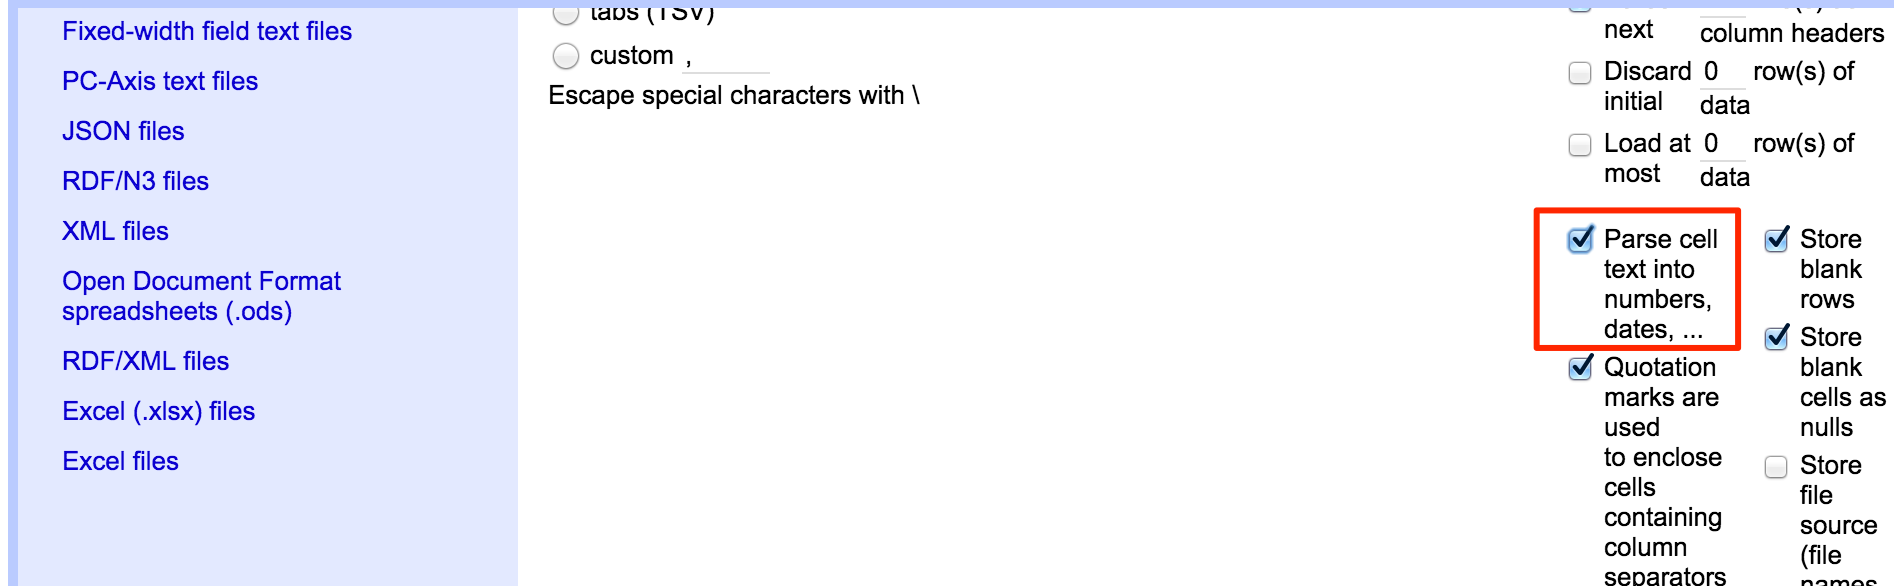
To start with, let’s see how we might generate a basic template from the complaints CSV file, loaded in with the setting to parse numerical columns as such.

OpenRefine

The default template looks something like this:

default template

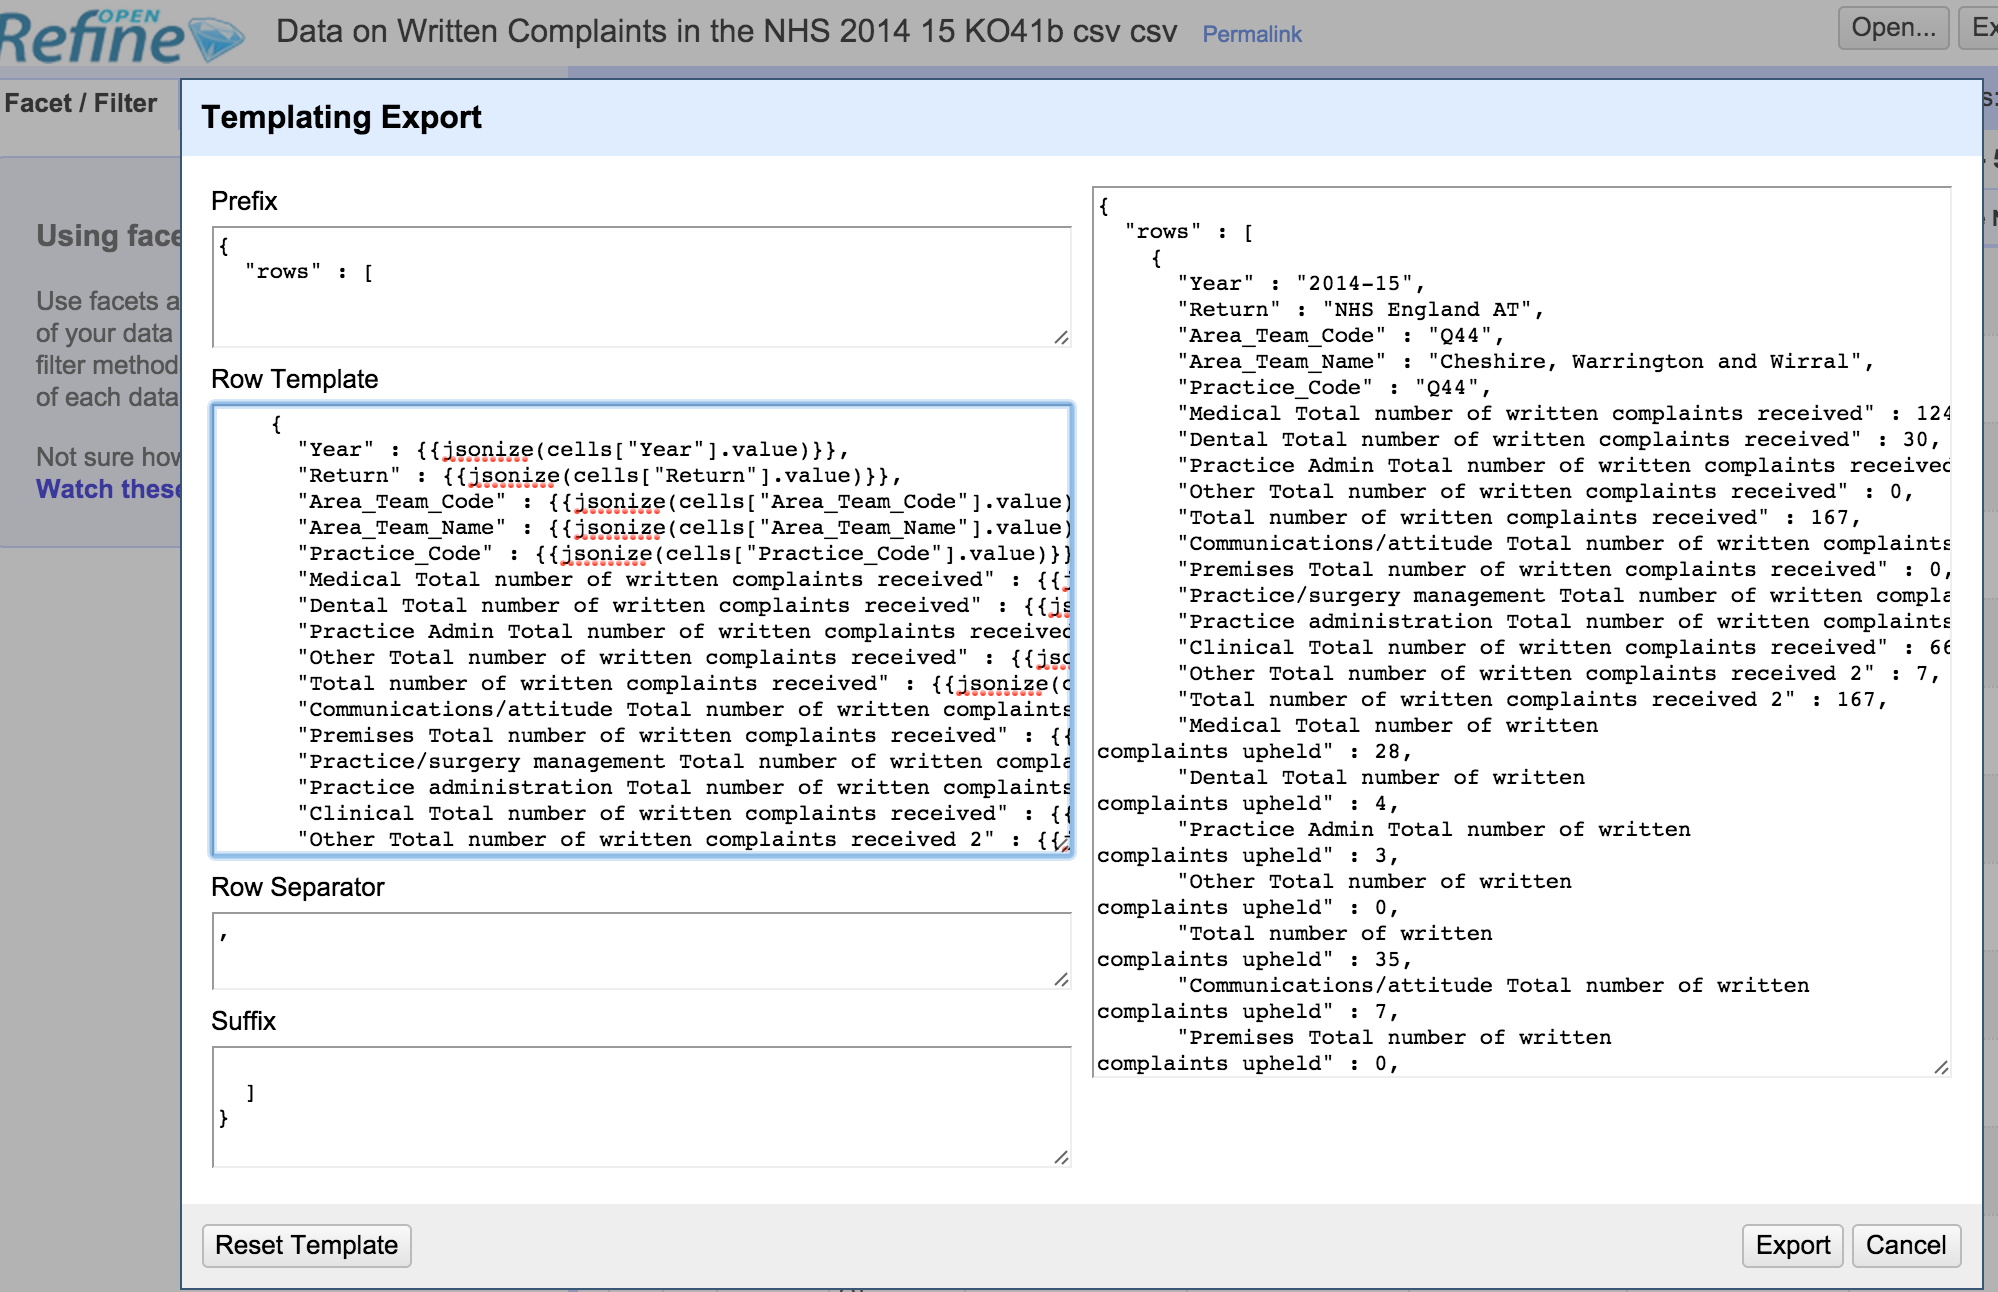
We can see how each the template provides a header slot, for the start of the output, a template applied to each row, a separator to spilt the rows, and a footer.

The jsonize function makes sure the output is suitable for output as a JSON file. We just want to generate text so we can forget that.

Here’s the start of a simple report…

Report for {{cells["Practice_Code"].value}} ({{cells["Year"].value}}):

  Total number of written complaints received:
  - by area: {{cells["Total number of written complaints received"].value}} (of which, {{cells["Total number of written 
complaints upheld"].value}} upheld)
  - by subject: {{cells["Total number of written complaints received 2"].value}} (of which, {{cells["Total number of written 
complaints upheld 2"].value}} upheld)

custom_export _start

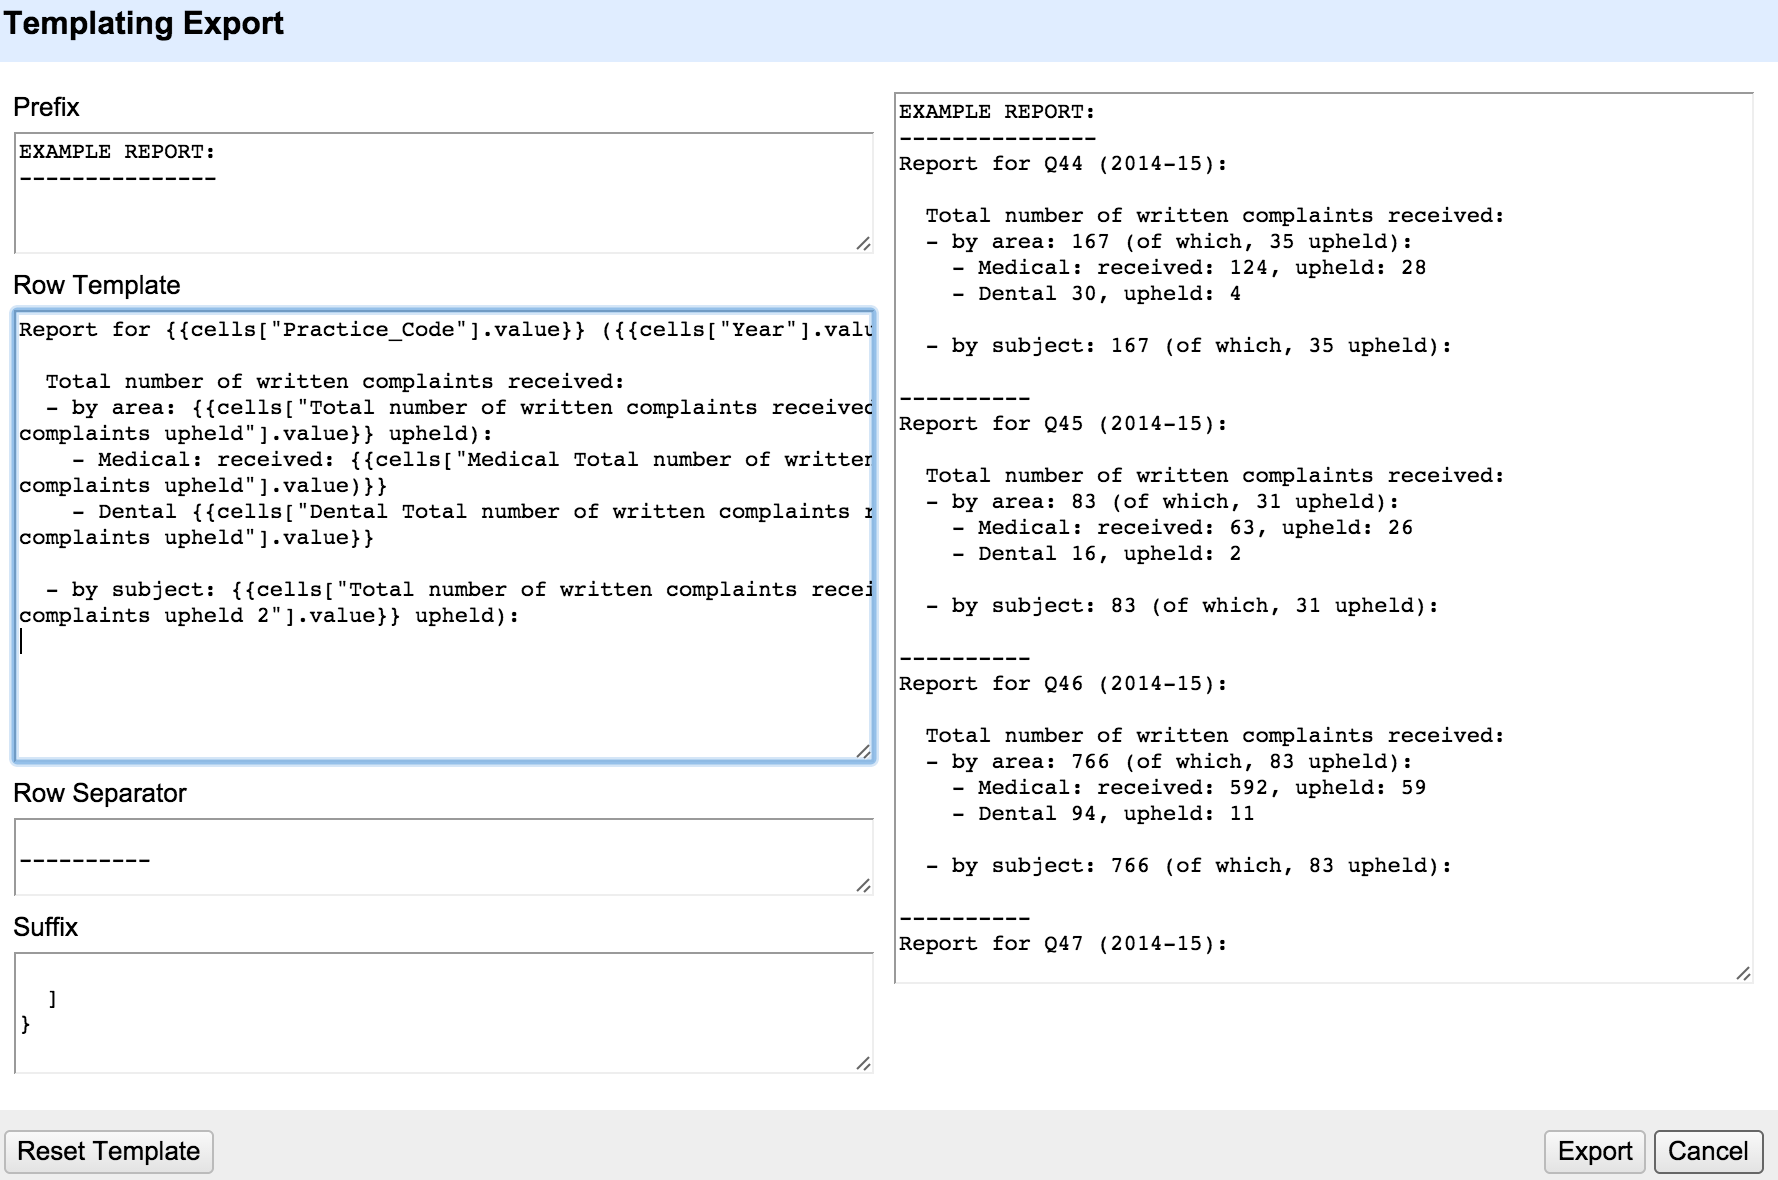
The double braces ({{ }} allow you to access GREL statements. Outside the braces, the content is treated as text.

Note that the custom template doesn’t get saved… I tend to write the custom templates in a text editor, then copy and paste them into OpenRefine.

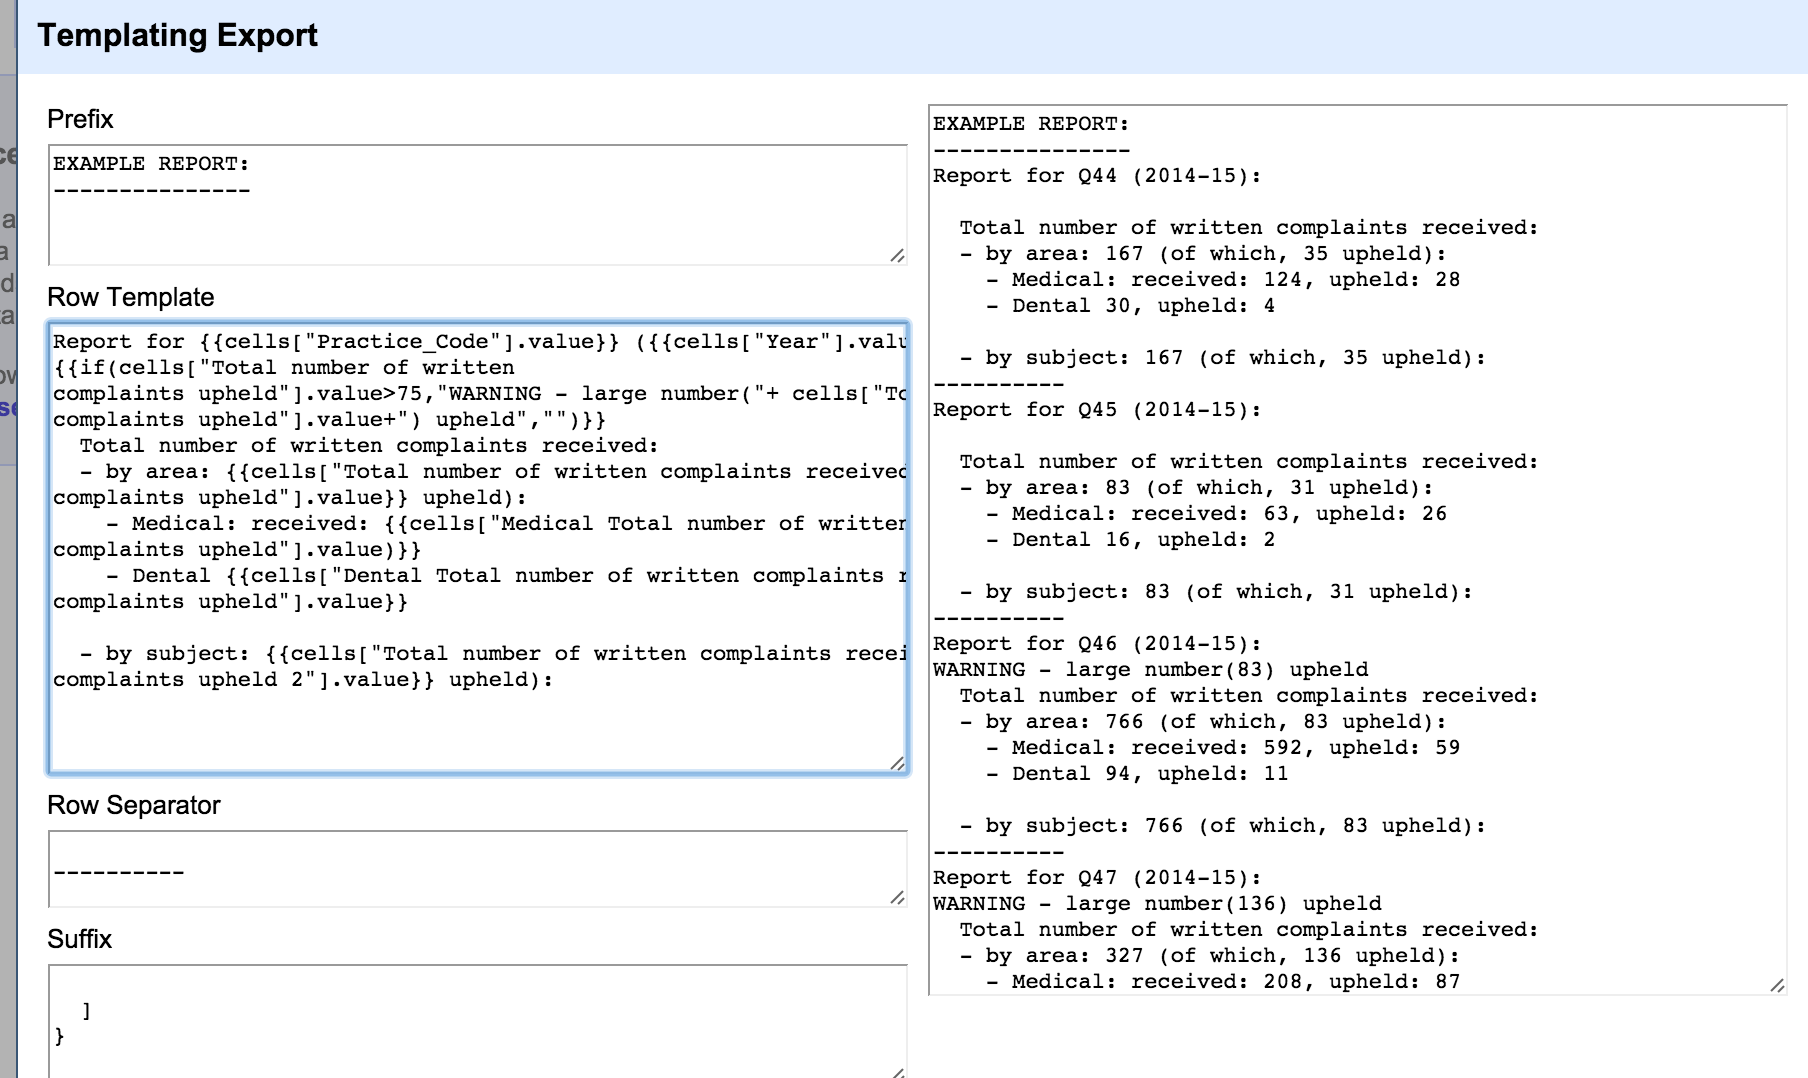
We can also customise the template with some additional logic using the if(CONDITION, TRUE_ACTION, FALSE_ACTION) construction. For example, we might flag a warning that a lot of complaints were upheld:

openrefine template warning

The original demonstration pulled in additional administrative information (practice name and address, for example) from another source spreadsheet. Merging Datasets with Common Columns in Google Refine describes a recipe for merging in data from another dataset. In this case, if our source is the epraccur spreadsheet, we can create an OpenRefine project from the epraccur spreadsheet (use no lines as the header – it doesn’t have a header row) and then merge in data from the epraccur project into the complaints project using the practice code (Column 1 in the epraccur project) as the key column used to add an additional practice name column based on the Practice_Code column in the complaints project – cell.cross("epraccur xls", "Column 1").cells["Column 2"].value[0]

Note that columns can only be merged in one column at a time.

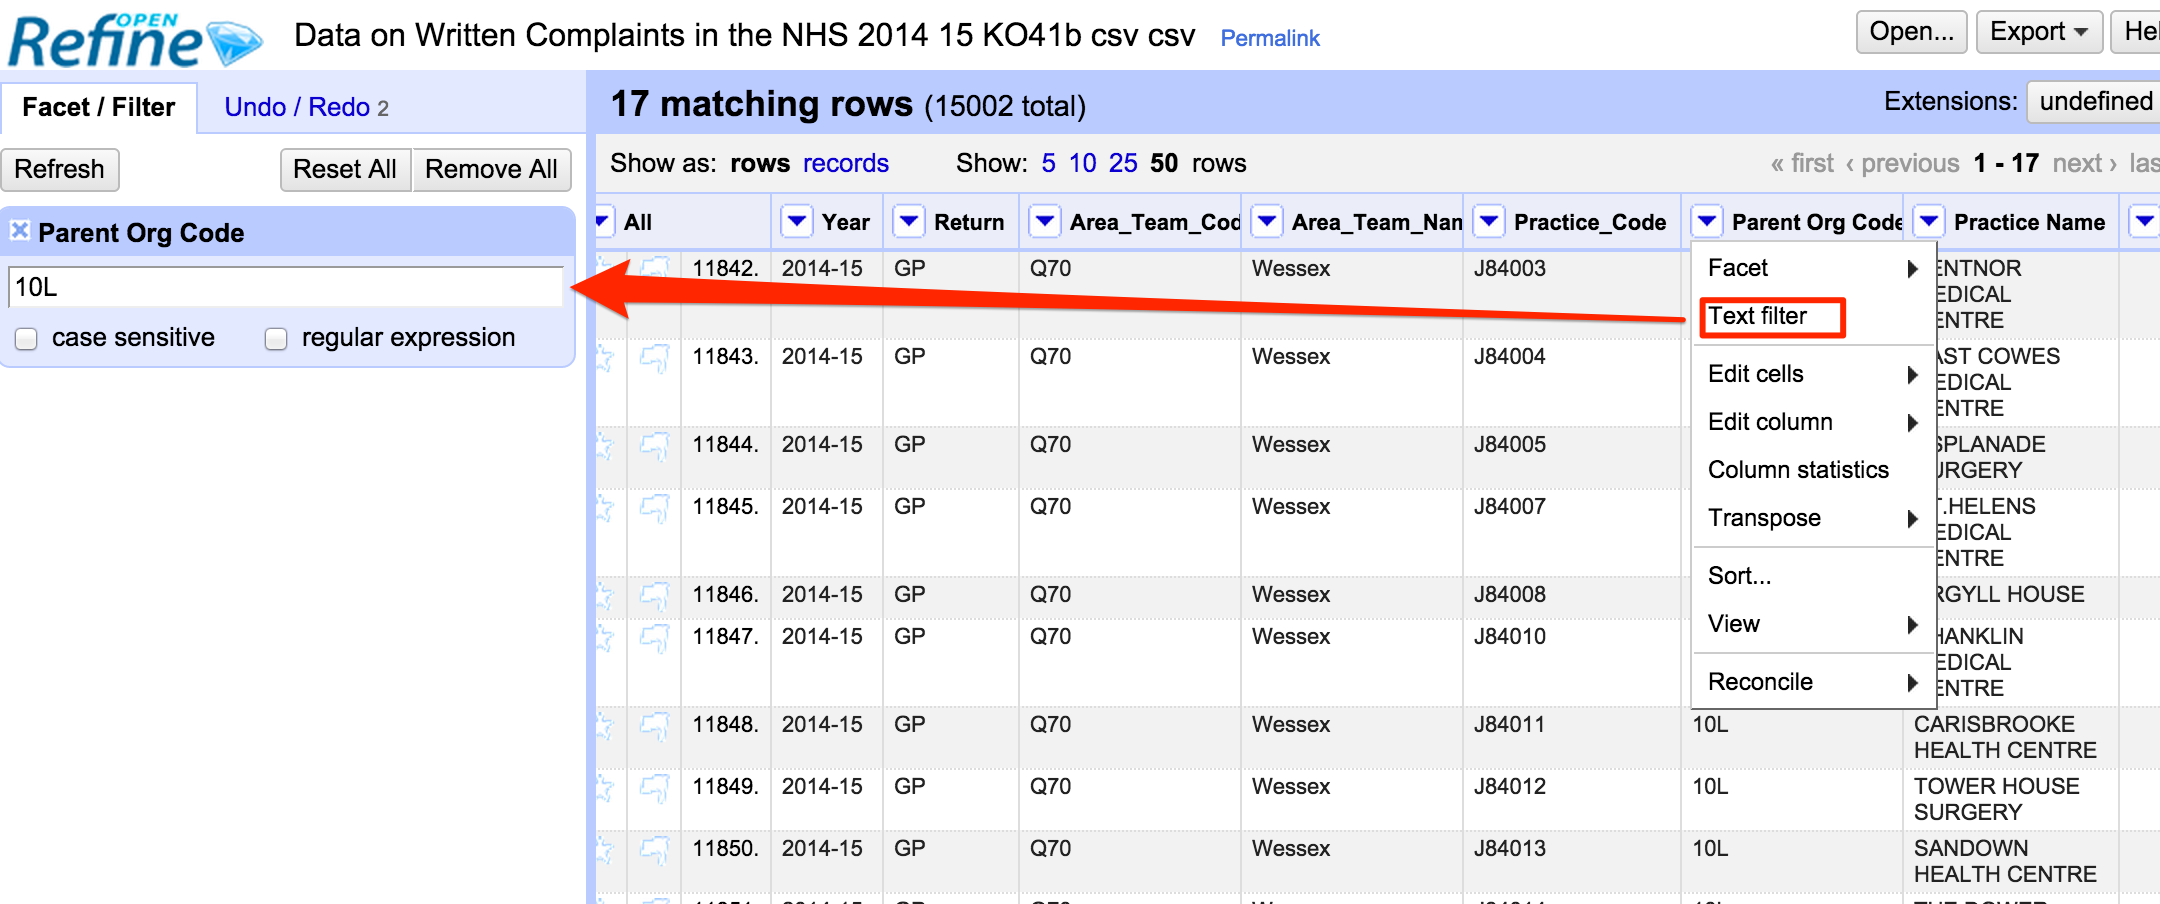
In order to filter the rows so we can generate reports for just the Isle of Wight, we also need to merge in the Parent Organisation Code (Column 15) from the epraccur project. To get Isle of Wight practices, we could then filter on code 10L. If we then used out custom exporter template, we could get just textual reports for the rows corresponding to Isle of Wight GP practices.

nhs openrefine filter

Teasing things apart a bit, we also start to get a feel for a more general process. Firstly, we can create a custom export template to generate a textual representation of each row in a dataset. Secondly, we can use OpenRefine’s filtering tools to select which rows we want to generate reports from, and order them appropriately. Thirdly, we could also generate new columns containing “red flags” or news signals associated with particular rows, and produce a weighted sum column on which to rank items in terms of newsworthiness. We might also want to merge in additional data columns from other sources, and add elements from those in to the template. Finally, we might start to refine the export template further to include additional logic and customisation of the news release output.

See also Putting Points on Maps Using GeoJSON Created by Open Refine for a demo of how to generate a geojson file using the OpenRefine custom template exporter as part of a route to getting points onto a map.

Fragment – Data Journalism or Data Processing?

A triptych to read and reflect on in the same breath…

String of Rulings Bodes Ill for the Future of Journalism in Europe:

On July 21, 2015, the European Court of Human Rights ruled that making a database of public tax records accessible digitally was illegal because it violated the right to privacy [1]. The judges wrote that publishing an individual’s (already public) data on an online service could not be considered journalism, since no journalistic comment was written alongside it.

This ruling is part of a wider trend of judges limiting what we can do with data online. A few days later, a court of Cologne, Germany, addressed data dumps. In this case, the German state sued a local newspaper that published leaked documents from the ministry of Defense related to the war in Afghanistan. The documents had been published in full so that users could highlight the most interesting lines. The ministry sued on copyright grounds and the judges agreed, arguing that the journalists should have selected some excerpts from the documents to make their point and that publishing the data in its entirety was not necessary [2].

These two rulings assume that journalism must take the form of a person collecting information then writing an article from it. It was true in the previous century but fails to account for current journalistic practices.

ICO: Samaritans Radar failed to comply with Data Protection Act:

It is our view that if organisations collect information from the internet and use it in a way that’s unfair, they could still breach the data protection principles even though the information was obtained from a publicly available source. It is particularly important that organisations should consider the data protection implications if they are planning to use analytics to make automated decisions that could have a direct effect on individuals.

The Labour Party “purge” and social media privacy:

[A news article suggests] that the party has been scouring the internet to find social media profiles of people who have registered. Secondly, it seems to suggest that for people not to have clearly identifiable social media profiles is suspicious.

The first idea, that it’s ‘OK’ to scour the net for social media profiles, then analyse them in detail is one that is all too common. ‘It’s in the public, so it’s fair game’ is the essential argument – but it relies on a fundamental misunderstanding of privacy, and of the way that people behave.

Collecting “public” data and processing or analysing it may bring the actions of the processor into the scope of the Data Protection Act. Currently, the Act affords protections to to journalists. But if these protections are eroded, it weakens the ability of journalists to use these powerful investigatory tools.

Writing Each Row of a Spreadsheet as a Press Release?

A few days ago, I saw via the @HSCICOpenData Twitter feed that an annually released dataset on Written Complaints in the NHS has just been published.

The data comes in the form of a couple of spreadsheets in which each row describes a count of the written complaints received and upheld under a variety of categories for each GP and dental practice, or local NHS trust.

The practice level spreadsheet looks like this:

nhs_complaints_data

Each practice is identified solely by a practice code – to find the name and address of the actual practice requires looking up the code in another dataset.

The column headings supplied in the CSV document only partially identify each column (and indeed, there are duplicates such as Total number of written complaints received, that a spreadsheet reader might disambiguate by adding numerical suffix to) – a more complete description (that shows how the columns are actually hierarchically defined) is provided in an associated metadata spreadsheet.

nhs_complaints_metadata

For a reporter wanting to know whether or not any practices in their area fared particularly badly in terms of the number of upheld complaints, the task might be broken down as follows:

  1. identify the practices in of interest from their practice codes (which requires finding a set of practice codes of interest);
  2. for each of those practices, look along the row to see whether or not there are any large numbers in the complaints upheld column.

But if you have a spreadsheet with 10, 20, 30 or more columns, scanning along a row looking for items of interest can rapidly become quite a daunting task.

So an idea I’ve been working on, which I suspect harkens back to the earliest days of database reporting, is to look at ways of turning each row of data into a text based, human readable report.

Something like the following, for example:

Sketching_a_handcrafted_data2text_report_for_diabetes_prescribing_

Each record, each “Complaint Report”, is a textual rendering of a single row from the practice complaints spreadsheet, with a bit of administrative metadata enrichment in the form of the practice name, address (and in later versions, telephone number).

These reports are quicker to scan, and could be sort or highlighted depending on the number of upheld complaints, for example. The journalist can then quickly review the reports, and identify any practices that might be worth phoning up for a comment to ask why they appear to have received a large number of upheld complaints in a particular area, for example… Data driven press releases used to assist reporting, in other words.

FWIW, I popped up a sketch script that generates the above report from the data, and also pulls in practice administrative metadata from an epracurr spreadsheet, here: NHS complaints spreadsheet2text sketch. See also: Data Driven Press Releases From HSCIC Data – Diabetes Prescribing.

PS I’m not Microsoft Office suite user, but I suspect you can get a fair way along this sort of process by using a mail merge? There may be other ways of generating templated reports too. Any Microsoft Office users fancy letting me know how you’d go about doing something like the above in Word and Excel? I’d guess complicating factors are the requirements to make use of the column headers and only display the items associated with non-zero counts, which perhaps requires some macro magic? Things could perhaps be simplified by reshaping the data, perhaps putting it into a long form by melting the complaints columns, or melting the complaints columns cannily to provide two value columns, once for complaints received and one for complaints upheld?

Screenshot_26_08_2015_23_48

Then you could filter out the blank rows before the merge.

“Student for Life” – A Lifelong Learning Relationship With Your University… Or Linked In?

I’ve posted several times over the years wondering why universities don’t try to reimagine themselves as see undergrad degrees as the starting point for a lifelong relationship as an educational service provider with their first-degree alumni.

A paragraph in an recent Educause Review article Data, Technology, and the Great Unbundling of Higher Education (via @Downes [commentary]) caught my eye this morning:

In an era of unbundling, when colleges and universities need to move from selling degrees to selling EaaS subscriptions, the winners will be those that can turn their students into “students for life” — providing the right educational programs and experiences at the right time.

On a quick read, there’s a lot in the article I don’t like, even though it sounds eminently reasonable, positing a competency based “full-stack model to higher education” in which providers will (1) develop and deliver specific high-quality educational experiences that produce graduates with capabilities that specific employers desperately want; (2) work with students to solve financing problems; and (3) connect students with employers during and following the educational experience and make sure students get a job.

The disruption that HE faces, then, is not one about course delivery, but rather one about life-as-career management?

What if … the software that will disrupt higher education isn’t courseware at all? What if the software is, instead, an online marketplace? Uber (market cap $40 billion) owns no vehicles. Airbnb (market cap $10 billion) owns no hotel rooms. What they do have are marketplaces with consumer-friendly interfaces. By positioning their interfaces between millions of consumers and sophisticated supply systems, Uber and Airbnb have significantly changed consumer behavior and disrupted these supply systems.

Is there a similar marketplace in the higher education arena? There is, and it has 40 million college students and recent graduates on its platform. It is called LinkedIn.

Competency marketplaces will profile the competencies (or capabilities) of students and job seekers, allow them to identify the requirements of employers, evaluate the gap, and follow the educational path that gets them to their destination quickly and cost-effectively. Although this may sound like science fiction, the gap between the demands of labor markets and the outputs of our educational system is both a complex sociopolitical challenge and a data problem that software, like LinkedIn, is in the process of solving. …

(I’m not sure if I don’t like the article because I disagree with it, or because it imagines a future that is one that I’d rather not see play out: the idea that learners don’t develop a longstanding relationship with a particular university, and consequently miss out on the social and cultural memories and relationships that develop therein, but instead taking occasional offerings from a wide a variety of providers and instead having their long term relationship with someone like LinkedIn, feels like something will be lost to me. Martin Weller captures some of it, I think, in his reflection yesterday on Product and process in higher ed in terms of how the “who knows?!” answer to the “what job are you going to do with that?” question about a particular degree becomes a nonsense answer, because the point of the degree has become just that: getting a particular job. Rather than taking a degree to widen your options, the degree becomes one of narrowing them down?! Maybe the first degree should be about setting yourself up to becoming a specialist over the course of occasional and extended education over a lifetime? UPDATE: related, this quote from an article on the “death of Twitter”: When a technology is used to shrink people’s possibilities, more than to expand them, it cannot create value for them. And so people will simply tune it out, ignore it, walk away from it if they can. In the sense that universities are a technology… hmmm…)

Furthermore, I get twitchy about this being another example of a situation where it’s tradable personal data that’s the valuable bargaining chip:

To avoid marginalization, colleges and universities need to insist that individuals own their competencies. Ensuring that ownership lies with the individual could make the competency profile portable and could facilitate movement across marketplaces, as well as to higher education institutions.

(As for how competencies are recognised, and fraud avoided in terms of folk claiming a competency that hasn’t be formally qualified, I’ve pondered this before, eg in the context of Time to build trust with an open achievements API?, or this idea for a Qualification Verification Service. It seems to me that universities don’t see it as their business proving that folk have the qualifications or certificates they’ve been awarded – which presumably means that if it does become yet another part of the EaaS marketplace, it’ll be purely corporate commercial interests that manage it.)

We’ll see….

What Would An Open Access Academic Library Look Like, and What Would an Open Access Academic Librarian Do?

In the context of something else, I mooted whether a particular project required an “open access academic library” as a throwaway comment, but it’s a phrase that’s been niggling at me, along with the associated “open access academic librarian”, so I’ll let my fingers do the talking and see what words come out…

Traditional academic libraries provide a range a services: they’re a home to physical content, and an access point to online subscription content; they provide managed collections that support discovery and retrieval of “quality” content; they promote skills development that allow folk to discover and retrieve content, and rate its quality, as well as providing expert levels of support for discovery and retrieval. They support teaching by forcing reading lists out of academics and making sure corresponding items are available to students. They have a role to play in managing a university’s research knowledge outputs, maintaining repositories of published papers and, in previous years, operating university presses. They are looking to support the data management needs of researchers, particularly with respect to the data publication requirements being placed on researchers by their funders. If they were IT empire builders, they’d insist that all academics can only engage with publishers through a library system that would act as an intermediary with the academic publishers and could automate the capture of pre-prints and supporting data; but they’re too gentle for that, preferring to ask politely for a copy, if we may… And they do cake – at least, they do if you go to meetings with the librarians on a regular basis.

To a certain extent, libraries are already wide-open access institutions, subject to attack, offering few barriers to entry, at least to their members, though unlikely to turn anyone with a good reason away, providing free-at-the-point of use access to materials held, or subscribed to, and often a peaceful physical location conducive to exploring ideas.

But what if the library needed to support an fully open-access student body, such as students engaged in an open education course of study, or an open research project, for a strict, rather than openwashed, definition of open? Or perhaps the library serves a wider community of people with problems that access to appropriate “academic” knowledge might help them solve? What would – could – the role of the library be, and what of the role of the librarian?

First, the library would have to be open to everyone. An open course has soft boundaries. A truly open course has no boundaries.

Secondly, the library would need to ensure that all the resources it provided a gateway to were openly licensed. So collections would be built from items listed on the Directory of Open Access Journals (DOAJ), perhaps? Indeed, open access academic librarians could go further and curate “meta-journal” readers of interest to their patrons (for example, I seem to remember Martin Weller experimenting with just such a thing a few years ago: Launching Meta EdTech Journal).

Thirdly, the open access academic library should also offer a gateway to good quality open textbook shelves and other open educational resources. As I found to my cost only recently, searching for useful OERs is not a trivial matter. Many OERs come in the form of lecture or tutorial notes, and as such are decontextualised, piecemeal trinkets. If you’re already at that part of the learning journey, another take on the “Mech Eng Structures, week 7” lecture might help. If you want to know out of nowhere how to work out the deflection of a shaped beam, finding some basic lecture notes – and trying to make sense of them – only gets you so far; other pieces (such as the method of superposition) seem to be required. Which is to say, you also need the backstory and a sensible trail that can walk you up to that resource so that you can start to make sense of it. And you might also need other bits of knowledge to answer the question you have to hand. (Which is where textbooks come in again – they embed separate resources in a coherent knowledge structure.)

Fourthly, to mitigate against commercial constraints on its activities, the open access library should explore open sustainability. Such as being built on, and contributing to, the development of open infrastructure (see also Principles for Open Scholarly Infrastructures; I don’t know whether things like Public Knowledge Project (PKP) would count as legitimate technology parts of such an infrastructure? Presumably things like CKAN and EPrints would?).

Fifthly, the open access librarian should offer open access librarian support, perhaps along the lines of invisible support or being an influential friend?

Sixthly, the open access digital library could provide access to online applications or online digital workbenches (of which, more in another post). For example, I noticed the other day that Bryn Mawr College provide student access to Jupyter (IPython) notebooks. Several years ago, the OU’s KMI made RStudio available online to researchers as part of KMI Crunch, and so on. You might argue that this is not really the role of the library – but physical academic libraries often provide computer access points to digital services and applications subscribed to by the university on behalf of the students, student desktops replete the software tools and applications the student needs for their courses. If I’m an open access learner with a netbook or a tablet, I couldn’t install desktop software on my computer even if I wanted to.

Seventhly, there probably is a seventh, and eigth, and maybe even a ninth and tenth, but my time’s up for this post.. (If only there were room in the margin of my time to write this post properly…;-)

Open Data For Transparency – Contract Compliance?

Doing a tab sweep just now, I came across a post describing a Policy note issued on contracts and compliance with transparency principles by the Crown Commercial Service [Procurement Policy Note – Increasing the Transparency of Contract Information to the Public – Action Note 13/15 31 July 2015 ] that requires “all central government departments including their Executive Agencies and Non-Departmental Public Bodies (NDPBs)” (and recommends that other public bodies follow suit) to publish a “procurement policy note” (PPN) “in advance of a contract award, [describing] the types of information to be disclosed to the public, and then to publish that information in an accessible form” for contracts advertised after September 1st, 2015.

The publishers should “explore [make available, and update as required] a range of types of information for disclosure which might typically include:-

i. contract price and any incentivisation mechanisms
ii. performance metrics and management of them
iii. plans for management of underperformance and its financial impact
iv. governance arrangements including through supply chains where significant contract value rests with subcontractors
v. resource plans
vi. service improvement plans”
.

The information so released may perhaps provide a hook around which public spending (transparency) data could be used to cross-check contract delivery. For example, “[w]here financial incentives are being used to drive performance delivery, these may also be disclosed and published once milestones are reached to trigger payments. Therefore, the principles are designed to enable the public to see a current picture of contractual performance and delivery that reflects a recent point in the contract’s life.” Spotting particular payments in transparency spending data as milestone payments could perhaps be used to cross-check back that those milestones were met in an appropriate fashion. Or where dates are associated in a contract with particular payments, this could be used to flag-up when payments might be due to appear in spending data releases, and raise a red flag if they are not?

Finally, the note further describes how:

[i]n-scope organisations should also ensure that the data published is in line with Open Data Principles. This means ensuring the data is accessible (ideally via the internet) at no more than the cost of reproduction, without limitations based on user identity or intent, in a digital, machine-readable format for interoperation with other data and free of restriction on use or redistribution in its licensing conditions

In practical terms, of course, how useful (if at all) any of this might be will in part determined by exactly what information is released, how, and in what form.

It also strikes me that flagging up what is required of a contract when it goes out to tender may still differ from what the final contract actually states (and how is that information made public?) And when contracts are awarded, where’s the data (as data) that clearly states who it was awarded to, in a trackable form, etc etc. (Using company numbers in contract award statements, as well as spending data, and providing contract numbers in spending data, would both help to make that sort of public tracking easier…)

Getting Your Own Space on the Web…

To a certain extent, we can all be web publishers now: social media let’s us share words, pictures and videos, online office suites allow us to publish documents and spreadsheets, code repositories allow us to share code, sites like Shinyapps.io allow you to publish specific sorts of applications, and so on.

So where do initiatives like a domain of one’s own come in, which provide members of a university (originally), staff and students alike, with a web domain and web hosting of their own?

One answer is that they provide a place on the web for you to call your own. With a domain name registered (and nothing else – not server requirements, no applications to install) you can set up an email address that you and you alone own and use it to forward mail sent to that address to any other address. You can also use your domain as a forwarding address or alias for other locations on the web. My ouseful.info domain forwards traffic to a blog hosted on wordpress.com (I pay WordPress for the privilege of linking to my site there with my domain address); another domain I registered – f1datajunkie.com – acts as an alias to a site hosted on blogger.com.

The problem with using my domains like this mean that I can only forward traffic to sites that other people operate – and what I can do on those sites is limited by those providers. WordPress is a powerful web publishing platform, but WordPress.com only offers a locked down experience with no allowances for customising the site using your own plugins. If I paid for my own hosting, and ran my own WordPress server, the site could be a lot richer. But then in turn I would have to administer the site for myself, running updates, being responsible – ultimately – for the security and resource provisioning of the site myself.

Taking the step towards hosting your own site is a big one, for many people (I’m too lazy to host my own sites, for example…) But initiatives like Reclaim Hosting, and more recently OU Create (from Oklahoma University, not the UK OU), originally inspired by a desire to provide a personal playspace in which students could explore their own digital creativity and give them a home on the web in which they could run their own applications, eased the pain for many: the host could also be trusted, was helpful, and was affordable.

The Oklahoma create space allows students to register a subdomain (e.g. myname.oucreate.com) or custom domain (e.g. ouseful.info) and associate it with what is presumably a university hosted serverspace into which users can presumably install their own applications.

So it seems to me we can tease apart two things:

  • firstly, the ability to own a bit of the web’s “namespace” by registering your own domain (ouseful.info, for example);
  • secondly, the ability to own a bit of the web’s “functionality space”: running your own applications that other people can connect to and make use of; this might be running your own possibly blogging platform, possibly customised using your own, or third party, extensions, or it might be running one or more custom applications you have developed on your own.

But what if you don’t want the responsibility of running, and maintaining, your own applications day in, day out? What if you only want to share an application to the web for a short period of time? What if you want to be able to “show and tell” and application for a particular class, and then put it back on the shelf, available to use again but not always running? Or what if you want to access an application that might be difficult to install, or isn’t available for your computer? Or you’re running a netbook or tablet, and the application you want isn’t available as an app, just as a piece of “traditionally installed software”?

I’ve started to think that docker style containers may offer a way of doing this. I’ve previously posted a couple of examples of how to run RStudio or OpenRefine via docker containers using a cloud host. How much nicer it would be if I could run such containers on a (sub)domain of my own running via a university host…

Which is to say – I don’t necessarily want a full hosting solution on a domain of my own, at least, not to start with, but I do want to be able to add my own bits of functionality to the web, for short periods of time at the least. That is, what I’d quite like is a convenient place to “publish” (in the sense of “run”) my own containerised apps; and then rip them down. And then, perhaps at a later date, take them away and run them on my own fully hosted domain.

Authoring Multiple Docs from a Single IPython Notebook

It’s my not-OU today, and whilst I should really be sacrificing it to work on some content for a FutureLearn course, I thought instead I’d tinker with a workflow tool related to the production process we’re using.

The course will be presented as a set of HTML docs on FutureLearn, supported by a set of IPython notebooks that learners will download and execute themselves.

The handover resources will be something like:

– a set of IPython notebooks;
– a Word document for each week containing the content to appear online. (This document will be used as the basis for multiple pages on the course website. The content is entered into the FutureLearn system by someone else as markdown (though I’m not sure what flavour?)
– for each video asset, a Word document containing the script;
– ?separate image files (the images will also be in the Word doc).

Separate webpages provide teaching that leads into a linked to IPython notebook. (Learners will be running IPython via Anaconda on their own desktops – which means tablet/netbook users won’t be able to do the interactive activities as currently delivered; we looked at using Wakari, but didn’t go with it; offering our own hosted solution or tmpnb server was considered out of scope.)

The way I have authored my week is to create a single IPython document that proceeds in a linear fashion, with “FutureLearn webpage” content authored using as markdown, as well as incorporating executed code cells, followed by “IPython notebook” activity content relating to the previous “webpage”. The “IPython notebook” sections are preceded by a markdown cell containing a NOTEBOOK START statement, and closed with markdown cell containing a NOTEBOOK END statement.

I then run a simple script that:

  • generates one IPython notebook per “IPython notebook” section;
  • creates a monolithic notebook containing all, but just, the “FutureLearn webpage” content;
  • generates a markdown version of that monolithic notebook;
  • uses pandoc to convert the monolithic markdown doc to a Microsoft Word/docx file.

fl_ipynb_workflow

Note that it would be easy enough to render each “FutureLearn webpage” doc as markdown directly from the original notebook source, into its own file that could presumably be added directly to FutureLearn, but that was seen as being overly complex compared to the original “copy rendered markdown from notebook into Word and then somehow generate markdown to put into FutureLearn editor” route.

import io, sys
import IPython.nbformat as nb
import IPython.nbformat.v4.nbbase as nb4

#Are we in a notebook segment?
innb=False

#Quick and dirty count of notebooks
c=1

#The monolithic notebook is the content ex of the separate notebook content
monolith=nb4.new_notebook()

#Load the original doc in
mynb=nb.read('ORIGINAL.ipynb',nb.NO_CONVERT)

#For each cell in the original doc:
for i in mynb['cells']:
    if (i['cell_type']=='markdown'):
        #See if we can stop a standalone notebook code delimiter
        if ('START NOTEBOOK' in i['source']):
            #At the start of a block, create a new notebook
            innb=True
            test=nb4.new_notebook()
        elif ('END NOTEBOOK' in i['source']):
            #At the end of the block, save the code to a new standalone notebook file
            innb=False
            nb.write(test,'test{}.ipynb'.format(c))
            c=c+1
        elif (innb):
            test.cells.append(nb4.new_markdown_cell(i['source']))
        else:
            monolith.cells.append(nb4.new_markdown_cell(i['source']))
    elif (i['cell_type']=='code'):
        #For the code cells, preserve any output text
        cc=nb4.new_code_cell(i['source'])
        for o in i['outputs']:
            cc['outputs'].append(o)
        #Route the code cell as required...
        if (innb):
            test.cells.append(cc)
        else:
            monolith.cells.append(cc)

#Save the monolithic notebook
nb.write(monolith,'monolith.ipynb')

#Convert it to markdown
!ipython nbconvert --to markdown monolith.ipynb

##On a Mac, I got pandoc via:
#brew install pandoc

#Generate a Microsoft .docx file from the markdown
!pandoc -o monolith.docx -f markdown -t docx monolith.md

What this means is that I can author a multiple chapter, multiple notebook minicourse within a single IPython notebook, then segment it into a variety of different standalone files using a variety of document types.

Of course, what I really should have been doing was working on the course material… but then again, it was supposed to be my not-OU today…;-)

PS The actual workflow, of course, turned out to be more traditional. Content for the FutureLearn website was copied from the notebooks into Word document, edited there, and then somehow converted to markdown for entry into FutureLearn. (I haven’t seen what the FutureLearn content entry forms look like – anyone got a user guide or screenshots they could share?) Which caused all sorts of fun with the tables and code styling…

Data Driven Press Releases From HSCIC Data – Diabetes Prescribing

By chance, I saw a tweet from the HSCIC yesterday announcing Prescribing for Diabetes, England – 2005/06 to 2014/15′ http://bit.ly/1J3h0g8 #hscicstats.

The data comes via a couple of spreadsheets, broken down at the CCG level.

As an experiment, I thought I’d see how quickly I could come up with a story form and template for generating a “data driven press release” that localises the data, and presents it in a textual form, for a particular CCG.

It took a couple of hours, and at the moment my recipe is hard coded to the Isle of Wight, but it should be easily generalisable to other CCGs (the blocker at the moment is identifying regional codes from CCG codes (the spreadsheets in the release don’t provide that linkage – another source for that data is required).

Anyway, here’s what I came up with:

Sketching_a_handcrafted_data2text_report_for_diabetes_prescribing_

Figures recently published by the HSCIC show that for the reporting period Financial 2014/2015, the total Net Ingredient Costs (NIC) for prescribed diabetes drugs was £2,450,628.59, representing 9.90% of overall Net Ingredient Costs. The ISLE OF WIGHT CCG prescribed 136,169 diabetes drugs items, representing 4.17% of all prescribed items. The average net ingredient cost (NIC) was £18.00 per item. This compares to 4.02% of items (9.85% of total NIC) in the Wessex (Q70) region and 4.45% of items (9.98% of total NIC) in England.

Of the total diabetes drugs prescribed, Insulins accounted for 21,170 items at a total NIC of £1,013,676.82 (£47.88 per item (on average), 0.65% of overall prescriptions, 4.10% of total NIC) and Antidiabetic Drugs accounted for 93,660 items at a total NIC of £825,682.54 (£8.82 per item (on average), 2.87% of overall prescriptions, 3.34% of total NIC).

For the NHS ISLE OF WIGHT CCG, the NIC in 2014/15 per patient on the QOF diabetes register in 2013/14 was £321.53. The QOF prevalence of diabetes, aged 17+, for the NHS ISLE OF WIGHT CCG in 2013/14 was 6.43%. This compares to a prevalence rate of 6.20% in Wessex and 5.70% across England.

All the text generator requires me to do is pass in the name of the CCG and the area code, and it does the rest. You can find the notebook that contains the code here: diabetes prescribing textualiser.

Fragments – Scraping Tabular Data from PDFs

Over the weekend, we went to Snetterton to watch the BTCC touring cars and go-for-it Ginetta Juniors. Timing sheets from the event are available on the TSL website, so I thought I’d have a play with the data…

Each series has it’s own results booklet, a multi-page PDF document containing a range of timing sheets. Here’s an example of part of one of them:

ginettaJnrSnetterton2015_pdf__page_28_of_44_

It’s easy enough to use tools like Tabula (at version 1.0 as of August, 2015) to extract the data from regular (ish) tables, but for more complex tables we’d need to do some additional cleaning.

For example, on a page like:

ginettaJnrSnetterton2015_pdf__page_35_of_44_

we get the data out simply by selecting the bits of the PDF we are interested in:

Select_Tables___Tabula_and_Downloads

and preview (or export it):

Export_Data___Tabula

Note that this would still require a bit of work to regularise it further, perhaps using something like OpenRefine.

When I scrape PDFs, I tend to use pdf2html (from the poppler package, I think?) and then parse in the resulting XML:

import os
fn='ginettaJnrSnetterton2015'
cmd = 'pdftohtml -xml -nodrm -zoom 1.5 -enc UTF-8 -noframes %s "%s" "%s"' % ( '',fn+'.pdf', os.path.splitext(fn+'.xml')[0])
# Can't turn off output? Throw it away...
cmd + " >/dev/null 2>&1"
os.system(cmd)

import lxml.etree

xmldata = open(fn+'.xml','r').read()
root = lxml.etree.fromstring(xmldata)
pages = list(root)

We can then quickly preview the “raw” data we’re getting from the PDF:

def flatten(el):
    result = [ (el.text or "") ]
    for sel in el:
        result.append(flatten(sel))
        result.append(sel.tail or "")
    return "".join(result)

def pageview(pages,page):
    for el in pages[page]:
        print( el.attrib['left'], el.attrib['top'],flatten(el))

TSL_-_BTCC_Scraper

The scraped data includes top and left co-ordinates for each text element. We can count how many data elements are found at each x (left) co-ordinate and use that to help build our scraper.

By eye, we can spot natural breaks in the counts…:

TSL_-_BTCC_Scraper2

but can we also detect them automatically? The Jenks Natural Breaks algorithm [code] looks like it tries to do that…

TSL_-_BTCC_Scraper4

The centres identified by the Jenks natural breaks algorithm could then be used as part of a default hierarchy to assign a particular data element to a particular column. Crudely, we might use something like the following:

TSL_-_BTCC_Scraper5

Whilst it’s quite possible to hand-build scrapers that inspect each element scraped from the PDF document in turn, I notice that the Tabula extraction engine now has a command line interface, so it may be worth spending some time looking at that instead. (It would also be nice if the Tabula GUI could be used to export configuration info, so you could highlight areas of a PDF using the graphical tools and then generate the command line parameter values for reuse from from the command line?)

PS another handy PDF table extractor is published by Scraperwiki: pdftables.com. Which is probably the way to go if you have the funds to pay for it…

PPS A handy summary from the Scraperwiki blog about the different sorts of table containing documents you often come across as PDFS: The four kinds of data PDF (“large tables”, “pivotted tables”, “transactions”, “reports”).

PPPS This also looks relevant – an MSc thesis by Anssi Nurminen, from Tampere University of Technology, on Algorithmic Extraction of Data in Tables in PDF; also this report by Burcu Yildiz, Katharina Kaiser, and Silvia Miksch on pdf2table: A Method to Extract Table Information from PDF Files and an associated Masters thesis by Burcu Yildiz, Information Extraction – Utilizing Table Patterns.