More Tinkering With PyTracery

Having started to look at using pytracery for data2text transforms with pandas dataframes, I’ve been pondering how to do computational things with it, such as counts, conditional tests, and loops.

Here’s where I’m at – defining counters, a branch / conditional statement, and a conditional loop:

def inc(text, *params):
    return str(int(text)+1)

def dec(text, *params):
    return str(int(text)-1)

def branch(text, *params):
    if text==params[0].strip(): 
        ans = params[1].strip()
    else:
        ans = params[2].strip()
    return '[answer:#{}#]'.format(ans)

def whileNot0(text, *params):
    if int(text) > 0:
        return '[i:{i}]'.format(i=str(int(text)-1))
    return '[do:#{}#]'.format(params[0].strip())

pytracery_logic = {
    'inc': inc,
    'dec': dec,
    'branch':branch,
    'whileNot0': whileNot0
}

Count example:

rules = {'origin': 'Count demo - #countdemo#',
         'countdemo':'Count at [cnt:#initval#]#cnt#.\n#addone#, #addanother#, #takeone#',
         'addone': 'Add one gives [cnt:#cnt.inc#]#cnt#',
         'addanother': 'add another one gives [cnt:#cnt.inc#]#cnt#',
         'takeone':'take one gives [cnt:#cnt.dec#]#cnt.int_to_words#',
}

grammar = tracery.Grammar(rules)
grammar.add_modifiers(pytracery_logic)
grammar.add_modifiers(inflect_english)

print(grammar.flatten('[initval:1]#origin#'))
> Count demo - Count at 1.
> Add one gives 2, add another one gives 3, take one gives two

Logical test:

rules={'origin':'Logical test:[branch:#condition#]#branch# Testing #value# gives: #answer#',
       'condition': '#value.branch(VeryTrue, answer1, answer2)#',
    'answer1':'This is true...',
    'answer2':'This is false...',
    'answer3':'nope',
    'answer':'answer3'
}

grammar = tracery.Grammar(rules)
grammar.add_modifiers(pytracery_logic)

print(grammar.flatten("[value:VeryTrue]#origin#"))
> Logical test: Testing VeryTrue gives: This is true...

print(grammar.flatten("[value:notTrue]#origin#"))
> Logical test: Testing notTrue gives: This is false...

Loop test:

rules = {'origin': 'Loop test: \n#loop#',
         'loop':'[while:#i.whileNot0(end)#]#while##do#',
         'do':'#action##loop#',
         'action':'- count is at #i#\n',
         'end':'All done'
        }

grammar = tracery.Grammar(rules)
grammar.add_modifiers(pytracery_logic)
print(grammar.flatten("[i:6]#origin#"))
> Loop test: 
> - count is at 5
> - count is at 4
> - count is at 3
> - count is at 2
> - count is at 1
> - count is at 0
> All done

I’m a bit out of the way of declarative thinking (which pytracery relies on) atm, so there may be more native /idiomatic ways of doing this sort of stuff in pytracery.

I’m also a bit rusty on assembler / machine code programming, so there may be better ways of phrasing basic computational operations using pytracery using those sorts of operators.

Next step is to see whether I can start to use these reasoning steps in association with data pulled from a pandas dataframe.

A Recipe for Automatically Going From Data to Text to Reveal.js Slides

Over the last few years, I’ve experimented on and off with various recipes for creating text reports from tabular data sets, (spreadsheet plugins are also starting to appear with a similar aim in mind). There are several issues associated with this, including:

  • identifying what data or insight you want to report from your dataset;
  • (automatically deriving the insights);
  • constructing appropriate sentences from the data;
  • organising the sentences into some sort of narrative structure;
  • making the sentences read well together.

Another approach to humanising the reporting of tabular data is to generate templated webpages that review and report on the contents of a dataset; this has certain similarities to dashboard style reporting, mixing tables and charts, although some simple templated text may also be generated to populate the page.

In a business context, reporting often happens via Powerpoint presentations. Slides within the presentation deck may include content pulled from a templated spreadsheet, which itself may automatically generate tables and charts for such reuse from a new dataset. In this case, the recipe may look something like:

exceldata2slide

#render via: http://blockdiag.com/en/blockdiag/demo.html
{
  X1[label='macro']
  X2[label='macro']

  Y1[label='Powerpoint slide']
  Y2[label='Powerpoint slide']

   data -> Excel -> Chart -> X1 -> Y1;
   Excel -> Table -> X2 -> Y2 ;
}

In the previous couple of posts, the observant amongst you may have noticed I’ve been exploring a couple of components for a recipe that can be used to generate reveal.js browser based presentations from the 20% that account for the 80%.

The dataset I’ve been tinkering with is a set of monthly transparency spending data from the Isle of Wight Council. Recent releases have the form:

iw_transparency_spending_data

So as hinted at previously, it’s possible to use the following sort of process to automatically generate reveal.js slideshows from a Jupyter notebook with appropriately configured slide cells (actually, normal cells with an appropriate metadata element set) used as an intermediate representation.

jupyterslidetextgen

{
  X1[label="text"]
  X2[label="Jupyter notebook\n(slide mode)"]
  X3[label="reveal.js\npresentation"]

  Y1[label="text"]
  Y2[label="text"]
  Y3[label="text"]

  data -> "pandas dataframe" -> X1  -> X2 ->X3
  "pandas dataframe" -> Y1,Y2,Y3  -> X2 ->X3

  Y2 [shape = "dots"];
}

There’s an example slideshow based on October 2016 data here. Note that some slides have “subslides”, that is, slides underneath them, so watch the arrow indicators bottom left to keep track of when they’re available. Note also that the scrolling is a bit hit and miss – ideally, a new slide would always be scrolled to the top, and for fragments inserted into a slide one at a time the slide should scroll down to follow them).

The structure of the presentation is broadly as follows:

demo_-_interactive_shell_for_blockdiag_-_blockdiag_1_0_documentation

For example, here’s a summary slide of the spends by directorate – note that we can embed charts easily enough. (The charts are styled using seaborn, so a range of alternative themes are trivially available). The separate directorate items are brought in one at a time as fragments.

testfullslidenotebook2_slides1

The next slide reviews the capital versus expenditure revenue spend for a particular directorate, broken down by expenses type (corresponding slides are generated for all other directorates). (I also did a breakdown for each directorate by service area.)

The items listed are ordered by value, and taken together account for at least 80% of the spend in the corresponding area. Any further items contributing more than 5%(?) of the corresponding spend are also listed.

testfullslidenotebook2_slides2

Notice that subslides are available going down from this slide, rather than across the mains slides in the deck. This 1.5D structure means we can put an element of flexible narrative design into the presentation, giving the reader an opportunity to explore the data, but in a constrained way.

In this case, I generated subslides for each major contributing expenses type to the capital and revenue pots, and then added a breakdown of the major suppliers for that spending area.

testfullslidenotebook2_slides3

This just represents a first pass at generating a 1.5D slide deck from a tabular dataset. A Pareto (80/20) heurstic is used to try to prioritise to the information displayed in order to account for 80% of spend in different areas, or other significant contributions.

Applying this principle repeatedly allows us to identify major spending areas, and then major suppliers within those spending areas.

The next step is to look at other ways of segmenting and structuring the data in order to produce reports that might actually be useful…

If you have any ideas, please let me know via the comments, or get in touch directly…

PS FWIW, it should be easy enough to run any other dataset that looks broadly like the example at the top through the same code with only a couple of minor tweaks…

First Thoughts on Automatically Generating Accessible Text Descriptions of ggplot Charts in R

In a course team accessibility briefing last week, Richard Walker briefly mentioned a tool for automatically generating text descriptions of Statistics Canada charts to support accessibility. On further probing, the tool, created by Leo Ferres, turned out to be called iGraph-Lite:

… an extensible system that generates natural language descriptions of statistical graphs, particularly those created for Statistics Canada online publication, “The Daily”. iGraph-Lite reads a graph from a set of graphing programs, builds intermediate representations of it in several formats (XML, CouchDB and OWL) and outputs a description using NLG algorithms over a “string template” mechanism.

The tool is a C# application compiled as a Windows application, with the code available (unchanged now for several years) on Github.

The iGraph-Lite testing page gives a wide range of example outputs:

iGraph_Testing_Page

Increasingly, online charts are labeled with tooltip data that allows a mouseover or tab action to pop-up or play out text or audio descriptions of particular elements of the chart. A variety of “good chart design” principles designed to support clearer, more informative graphics (for example, sorting categorical variable bars in a bar chart by value rather than using an otherwise arbitrary alphabetic ordering) not only improves the quality of the graphic, it also makes a tabbed through audio description of the chart more useful. For more tips on writing clear chart and table descriptions, see Almost Everything You Wanted to Know About Making Tables and Figures.

The descriptions are quite formulaic, and to a certain extent represent a literal reading of the chart, along with some elements of interpretation and feature detection/description.

Here are a couple of examples – first, for a line chart:

This is a line graph. The title of the chart is “New motor vehicle sales surge in January”. There are in total 36 categories in the horizontal axis. The vertical axis starts at 110.0 and ends at 160.0, with ticks every 5.0 points. There are 2 series in this graph. The vertical axis is Note: The last few points could be subject to revisions when more data are added. This is indicated by the dashed line.. The units of the horizontal axis are months by year, ranging from February, 2005 to January, 2007. The title of series 1 is “Seasonally adjusted” and it is a line series. The minimum value is 126.047 occuring in September, 2005. The maximum value is 153.231 occuring in January, 2007. The title of series 2 is “Trend” and it is a line series. The minimum value is 133.88 occuring in February, 2005. The maximum value is 146.989 occuring in January, 2007.

And then for a bar chart:

This is a vertical bar graph, so categories are on the horizontal axis and values on the vertical axis. The title of the chart is “Growth in operating revenue slowed in 2005 and 2006”. There are in total 6 categories in the horizontal axis. The vertical axis starts at 0.0 and ends at 15.0, with ticks every 5.0 points. There is only one series in this graph. The vertical axis is % annual change. The units of the horizontal axis are years, ranging from 2001 to 2006. The title of series 1 is “Wholesale” and it is a series of bars. The minimum value is 2.1 occuring in 2001. The maximum value is 9.1 occuring in 2004.

One of the things I’ve pondered before was the question of textualising charts in R using a Grammar of Graphics approach such as that implemented by ggplot2. As well as literal textualisation of grammatical components, a small amount of feature detection or analysis could also be used to pull out some meaningful points. (It also occurs to me that the same feature detection elements could also then be used to drive a graphical highlighting layer back in the visual plane.)

Prompted by my quick look at the iGraph documentation, I idly wondered how easy it would be to pick apart an R ggplot2 chart object and generate a textual description of various parts of it.

A quick search around suggested two promising sources of structured data associated with the chart objects directly: firstly, we can interrogate the object return from calling ggplot() and it’s associated functions directly; and ggplot_build(g), which allows us to interrogate a construction generated from that object.

Here’s an example from the quickest of plays around this idea:

library(ggplot2)
g=ggplot(economics_long, aes(date, value01, colour = variable))
g = g + geom_line() + ggtitle('dummy title')

#The label values may not be the actual axis limits
txt=paste('The chart titled"', g$labels$title,'";',
'with x-axis', g$labels$x,'labeled from',
ggplot_build(g)$panel$ranges[[1]]$x.labels[1], 'to',
tail(ggplot_build(g)$panel$ranges[[1]]$x.labels, n=1),
'and y-axis', g$labels$y,' labeled from',
ggplot_build(g)$panel$ranges[[1]]$y.labels[1], 'to',
tail(ggplot_build(g)$panel$ranges[[1]]$y.labels,n=1), sep=' ')
if (<span class="pl-s"><span class="pl-pds">'</span>factor<span class="pl-pds">'</span></span> <span class="pl-k">%in%</span> class(<span class="pl-smi">x</span><span class="pl-k">$</span><span class="pl-smi">data</span>[[<span class="pl-smi">x</span><span class="pl-k">$</span><span class="pl-smi">labels</span><span class="pl-k">$</span><span class="pl-smi">colour</span>]])){
txt=paste(txt, '\nColour is used to represent', g$labels$colour)

if ( class(g$data[[g$labels$colour]]) =='factor') {
txt=paste(txt,', a factor with levels: ',
paste(levels(g$data[[g$labels$colour]]), collapse=', '), '.', sep='')
}
}

txt

#The chart titled "dummy title" with x-axis date labeled from 1970 to 2010 and y-axis value01 labeled from 0.00 to 1.00
#Colour is used to represent variable, a factor with levels: pce, pop, psavert, uempmed, unemploy.&amp;amp;amp;quot;

So for a five minute hack, I’d rate that approach as plausible, perhaps?!

I guess an alternative approach might also be to add an additional textualise=True property to the ggplot() call that forces each ggplot component to return a text description of its actions, and/or features that might be visually obvious from the action of the component as well as, or instead of, the graphical elements. Hmm… maybe I should use the same syntax as ggplot2 and try to piece together something along the lines of a ggdescribe library? Rather than returning graphical bits, each function would return appropriate text elements to the final overall description?!

I’m not sure if we could call the latter approach a “transliteration” of a chart from a graphical to a textual rendering of its structure and some salient parts of a basic (summary) interpretation of it, but it feels to me that this has some merit as a strategy for thinking about data2text conversions in general. Related to this, I note that Narrative Science have teamed up with Microsoft Power BI to produce a “Narratives for Power BI” plugin. I imagine this will start trickling down to Excel at some point, though I’ve already commented on how simple text summarisers can be added into to Excel using simple hand-crafted formulas (Using Spreadsheets That Generate Textual Summaries of Data – HSCIC).

PS does anyone know if Python/matplotib chart elements also be picked apart in a similar way to ggplot objects? [Seems as if they can: example via Ben Russert.]

PPS In passing, here’s something that does look like it could be handy for simple natural language processing tasks in Python: polyglot, “a natural language pipeline that supports massive multilingual applications”; includes language detection, tokenisation, named entity extraction, part of speech tagging, transliteration, polarity (i.e. crude sentiment).

PPPS the above function is now included in Jonathan Godfrey’s BrailleR package (about).

PPPPS for examples of best practice chart description, see the UK Association for Accessible Formats (UKAAF) guidance on Accessible Images.

PPPPPS rules for converting eg MathJax and MathML to speech, braille, etc

PPPPPPS a possibly handy R package — equatiomatic — for generating a LaTeX equation that describes a fitted R model. In Python, erwanp/pytexit will “convert a Python expression to a LaTeX formula”.

Writing Each Row of a Spreadsheet as a Press Release?

A few days ago, I saw via the @HSCICOpenData Twitter feed that an annually released dataset on Written Complaints in the NHS has just been published.

The data comes in the form of a couple of spreadsheets in which each row describes a count of the written complaints received and upheld under a variety of categories for each GP and dental practice, or local NHS trust.

The practice level spreadsheet looks like this:

nhs_complaints_data

Each practice is identified solely by a practice code – to find the name and address of the actual practice requires looking up the code in another dataset.

The column headings supplied in the CSV document only partially identify each column (and indeed, there are duplicates such as Total number of written complaints received, that a spreadsheet reader might disambiguate by adding numerical suffix to) – a more complete description (that shows how the columns are actually hierarchically defined) is provided in an associated metadata spreadsheet.

nhs_complaints_metadata

For a reporter wanting to know whether or not any practices in their area fared particularly badly in terms of the number of upheld complaints, the task might be broken down as follows:

  1. identify the practices in of interest from their practice codes (which requires finding a set of practice codes of interest);
  2. for each of those practices, look along the row to see whether or not there are any large numbers in the complaints upheld column.

But if you have a spreadsheet with 10, 20, 30 or more columns, scanning along a row looking for items of interest can rapidly become quite a daunting task.

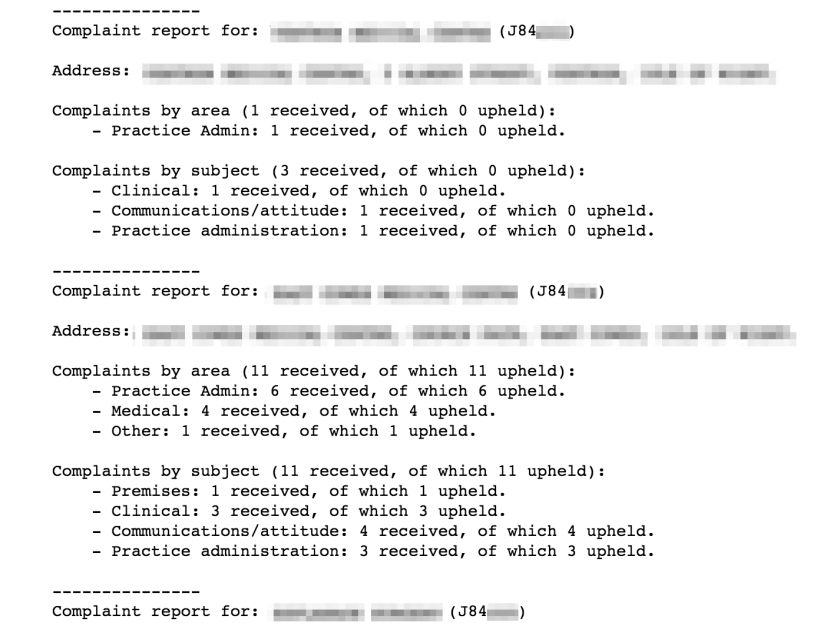
So an idea I’ve been working on, which I suspect harkens back to the earliest days of database reporting, is to look at ways of turning each row of data into a text based, human readable report.

Something like the following, for example:

Sketching_a_handcrafted_data2text_report_for_diabetes_prescribing_

Each record, each “Complaint Report”, is a textual rendering of a single row from the practice complaints spreadsheet, with a bit of administrative metadata enrichment in the form of the practice name, address (and in later versions, telephone number).

These reports are quicker to scan, and could be sort or highlighted depending on the number of upheld complaints, for example. The journalist can then quickly review the reports, and identify any practices that might be worth phoning up for a comment to ask why they appear to have received a large number of upheld complaints in a particular area, for example… Data driven press releases used to assist reporting, in other words.

FWIW, I popped up a sketch script that generates the above report from the data, and also pulls in practice administrative metadata from an epracurr spreadsheet, here: NHS complaints spreadsheet2text sketch. See also: Data Driven Press Releases From HSCIC Data – Diabetes Prescribing.

PS I’m not Microsoft Office suite user, but I suspect you can get a fair way along this sort of process by using a mail merge? There may be other ways of generating templated reports too. Any Microsoft Office users fancy letting me know how you’d go about doing something like the above in Word and Excel? I’d guess complicating factors are the requirements to make use of the column headers and only display the items associated with non-zero counts, which perhaps requires some macro magic? Things could perhaps be simplified by reshaping the data, perhaps putting it into a long form by melting the complaints columns, or melting the complaints columns cannily to provide two value columns, once for complaints received and one for complaints upheld?

Screenshot_26_08_2015_23_48

Then you could filter out the blank rows before the merge.

Data Driven Press Releases From HSCIC Data – Diabetes Prescribing

By chance, I saw a tweet from the HSCIC yesterday announcing Prescribing for Diabetes, England – 2005/06 to 2014/15′ http://bit.ly/1J3h0g8 #hscicstats.

The data comes via a couple of spreadsheets, broken down at the CCG level.

As an experiment, I thought I’d see how quickly I could come up with a story form and template for generating a “data driven press release” that localises the data, and presents it in a textual form, for a particular CCG.

It took a couple of hours, and at the moment my recipe is hard coded to the Isle of Wight, but it should be easily generalisable to other CCGs (the blocker at the moment is identifying regional codes from CCG codes (the spreadsheets in the release don’t provide that linkage – another source for that data is required).

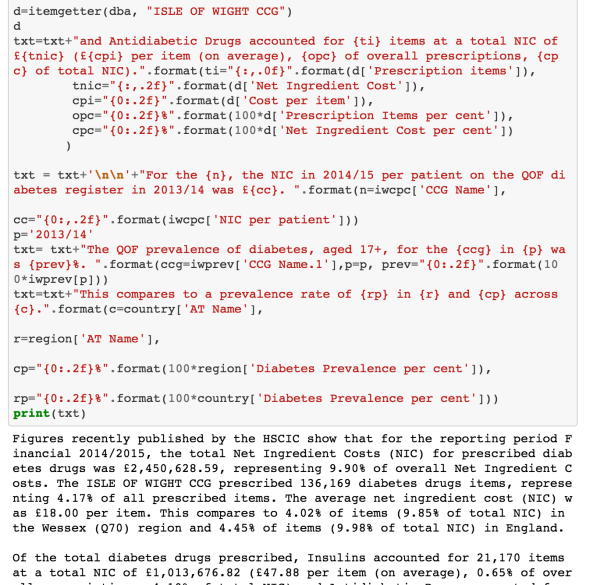
Anyway, here’s what I came up with:

Sketching_a_handcrafted_data2text_report_for_diabetes_prescribing_

Figures recently published by the HSCIC show that for the reporting period Financial 2014/2015, the total Net Ingredient Costs (NIC) for prescribed diabetes drugs was £2,450,628.59, representing 9.90% of overall Net Ingredient Costs. The ISLE OF WIGHT CCG prescribed 136,169 diabetes drugs items, representing 4.17% of all prescribed items. The average net ingredient cost (NIC) was £18.00 per item. This compares to 4.02% of items (9.85% of total NIC) in the Wessex (Q70) region and 4.45% of items (9.98% of total NIC) in England.

Of the total diabetes drugs prescribed, Insulins accounted for 21,170 items at a total NIC of £1,013,676.82 (£47.88 per item (on average), 0.65% of overall prescriptions, 4.10% of total NIC) and Antidiabetic Drugs accounted for 93,660 items at a total NIC of £825,682.54 (£8.82 per item (on average), 2.87% of overall prescriptions, 3.34% of total NIC).

For the NHS ISLE OF WIGHT CCG, the NIC in 2014/15 per patient on the QOF diabetes register in 2013/14 was £321.53. The QOF prevalence of diabetes, aged 17+, for the NHS ISLE OF WIGHT CCG in 2013/14 was 6.43%. This compares to a prevalence rate of 6.20% in Wessex and 5.70% across England.

All the text generator requires me to do is pass in the name of the CCG and the area code, and it does the rest. You can find the notebook that contains the code here: diabetes prescribing textualiser.