One of the things I’ve kept stumbling over in Google Refine is how to use it to reshape a data set, so I had a little play last week and worked out a couple of new (to me) recipes.
The first relates to reshaping data by creating new rows based on columns. For example, suppose we have a data set that has rows relating to Olympics events, and columns relating to Medals, with cell entries detailing the country that won each medal type:
However, suppose that you need to get the data into a different shape – maybe one line per country with an additional column specifying the medal type. Something like this, for example:
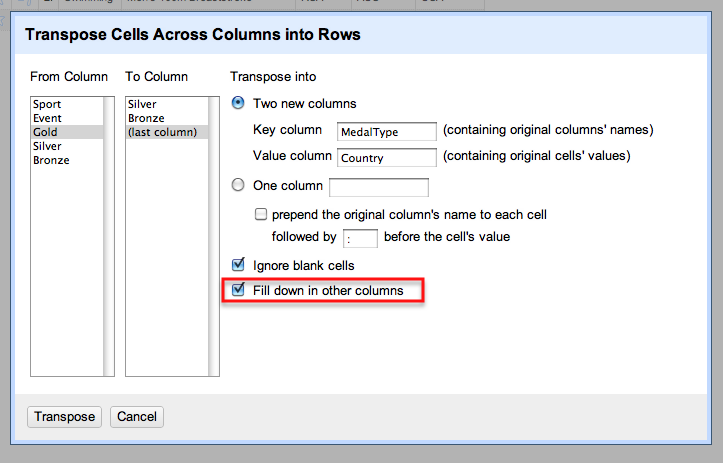
How can we generate that sort of view from the original data set? Here’s one way, that works when the columns you want to split into row values are contiguous (that is, next to each other). From the first column in the set of columns you want to be transformed, select Transpose > Transpose cells across columns into rows:
We now set the original selected column headers to be the cell value within a new column – MedalType – and the original cell values the value within a Country column:
(Note that we could also just transform the data into a single column. For example, suppose we had columns relating to courses currently taken by a particular student (Course 1, Course 2, Course 3), with a course code as cell value and one, two or three columns populated per student. If we wanted one row per student per course, we could just map the three columns onto a single column – CourseCode – and assign multiple rows to each student, then filtering out rows with a blank value in the CourseCOde column as required.)
Ticking the Fill down in other columns checkbox ensures that the appropriate Sport and Event values are copied in to the newly created rows:
Having worked out how to do that oft-required bit of data reshaping, I thought I could probably have another go at something that has been troubling me for ages – how to generate multiple rows from a single row where one of the columns contains JSON data (maybe pulled from a web service/API) that contains multiple items. This is a “mate in three” sort of problem, so here’s how I started to try to work it back. Given that I now know how to map columns onto rows, can I work out how to map different results in a JSON response onto different columns?
For example, here’s a result from the Facebook API for a search on a particular OU course code and the word open in a Facebook group name:
{“data”:[{“version”:1,”name”:”U101 (Open University) start date February 2012″,”id”:”325165900838311″},{“version”:1,”name”:”Open university, u101- design thinking, October 2011″,”id”:”250227311674865″},{“version”:1,”name”:”Feb 2011 Starters U101 Design Thinking – Open University”,”id”:”121552081246861″},{“version”:1,”name”:”Open University – U101 Design Thinking, Feburary 2011″,”id”:”167769429928476″}],”paging”:{“next”:…etc…}}
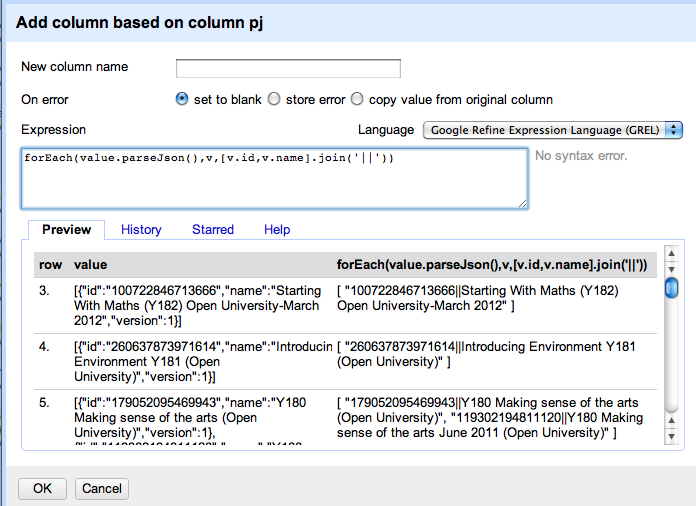
It returns a couple of results in the data element, in particular group name and group ID. Here’s one way I found of creating one row per group… Start off by creating a new column based on the JSON data column that parses the results in the data element into a list:
We can then iterate over the list items in this new column using the forEach grel command. The join command then joins the elements within each list item, specifically the group ID and name values in each result:
forEach(value.parseJson(),v,[v.id,v.name].join('||'))
You’ll notice that for multiple results, this produces a list of joined items, which we can also join together by extending the GREL expression:
forEach(value.parseJson(),v,[v.id,v.name].join('||')).join('::')
We now have a column that contains ‘||’ and ‘::’ separated items – :: separates individual group results from each other, || separates the id and name for each particular group.
Given we know how to create rows from multiple columns, we could try to split this column into separate columns using Edit column > Split into separate columns. This would create one column per result, which we could then transform into rows, as we did above. Whilst I don’t recommend this route in this particular case, here’s how we could go about doing it…
A far better approach is to use the Edit cells > split multi-valued cells option to automatically create new rows based on splitting the elements in a single column:
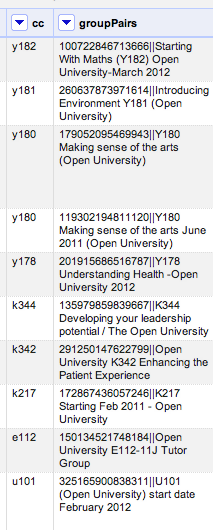
Note, however that this creates blanks in the other columns, so we need to Edit cells > Fill down to fill in the blanks in any other columns we want to refer to. After doing that, we end up with something like this:
We could now split the groupPairs column using the || separator to create two columns – Group ID and group name – giving us one row per group, and separate columns identifying the course, group name and group ID.
If the above route seems a little complicated, fear not…Once you apply it, it starts to make sense!


Reblogged this on Manipulate Magazine: Math 4 You By Us Group Illinois.