Draft Communications Data Bill, The Second Coming?

As many will already know, the 2012 Queen’s Speech included mention of a Draft Communications Data Bill (would JISC folk class this as being all about paradata, I wonder?!;-)- here are the relevant briefing notes as published by the Home Office Press Office – Queen’s Speech Briefing Notes:

Draft Communications Data Bill
“My Government intends to bring forward measures to maintain the ability of the law enforcement and intelligence agencies to access vital communications data under strict safeguards to protect the public, subject to scrutiny of draft clauses.”

The purpose of the draft Bill is to:

The draft Bill would protect the public by ensuring that law enforcement agencies and others continue to have access to communications data so that they can bring offenders to justice.

What is communications data:
– Communications data is information about a communication, not the communication itself. – Communication data is NOT the content of any communication – the text of an email, or conversation on a telephone.
– Communications data includes the time and duration of the communication, the telephone number or email address which has been contacted and sometimes the location of the originator of the communication.

The main benefits of the draft Bill would be:

– The ability of the police and intelligence agencies to continue to access communications data which is vital in supporting their work in protecting the public.
– An updated framework for the collection, retention and acquisition of communications data which enables a flexible response to technological change.

The main elements of the draft Bill are:

– Establishing an updated framework for the collection and retention of communications data by communication service providers (CSPs) to ensure communications data remains available to law enforcement and other authorised public authorities.
– Establishing an updated framework to facilitate the lawful, efficient and effective obtaining of communications data by authorised public authorities including law enforcement and intelligence agencies.
– Establishing strict safeguards including: a 12 month limit of the length of time for which communications data may be retained by CSPs and measures to protect the data from unauthorised access or disclosure. (It will continue to be the role of the Information Commissioner to keep under review the operation of the provisions relating to the security of retained communications data and their destruction at the end of the 12 month retention period).
– Providing for appropriate independent oversight including: extending the role of the Interception of Communications Commissioner to oversee the collection of communications data by communications service providers; providing a communications service provider with the ability to consult an independent Government / Industry body (the Technical Advisory Board) to consider the impact of obligations placed upon them; extending the role of the independent Investigatory Powers Tribunal (made up of senior judicial figures) to ensure that individuals have a proper avenue of complaint and independent investigation if they think the powers have been used unlawfully.
– Removing other statutory powers with weaker safeguards to acquire communications data.

Existing legislation in this area is:

Regulation of Investigatory Powers Act 2000
The Data Retention (EC Directive) Regulations 2009

It’s worth remembering that this is the second time in recent years that a draft communications data bill has been mooted. Here’s how it was described last time round, in the 2008/2009 draft legislative programme:

“A communications data bill would help ensure that crucial capabilities in the use of communications data for counter-terrorism and investigation of crime continue to be available. These powers would be subject to strict safeguards to ensure the right balance between privacy and protecting the public;”

The purpose of the Bill is to: allow communications data capabilities for the prevention and detection of crime and protection of national security to keep up with changing technology through providing for the collection and retention of such data, including data not required for the business purposes of communications service providers; and to ensure strict safeguards continue to strike the proper balance between privacy and protecting the public.

The main elements of the Bill are:
– Modify the procedures for acquiring communications data and allow this data to be retained
– Transpose EU Directive 2006/24/EC on the retention of communications data into UK law.

The main benefits of the Bill are:
– Communications data plays a key role in counter-terrorism investigations, the prevention and detection of crime and protecting the public. The Bill would bring the legislative framework on access to communications data up to date with changes taking place in the telecommunications industry and the move to using Internet Protocol (IP) core network
– Unless the legislation is updated to reflect these changes, the ability of authorities to carry out their counter-terror, crime prevention and public safety duties and to counter these threats will be undermined.

(See also some briefing notes from the time (January 2009).)

What strikes me immediately about the earlier statement was its use of anti-terrorism rhetoric to justify the introduction of the proposed bill, rhetoric which appears to have been dropped this time round.

It’s also worth noting that the 2008 proposals regarding EU Directive 2006/24/EC (retention of communications data) were passed in to law via a Statutory Instrument, The Data Retention (EC Directive) Regulations 2009, regulations that it appears will be up for review/revision via the new draft bill. In those regulations:

[2b] – “communications data” means traffic data and location data and the related data necessary to identify the subscriber or user;

[2d] – “location data” means data processed in an electronic communications network indicating the geographical position of the terminal equipment of a user of a public electronic communications service, including data relating to: (i) the latitude, longitude or altitude of the terminal equipment, (ii) the direction of travel of the user, or (iii) the time the location information was recorded;
[2e] – “public communications provider” means: (i) a provider of a public electronic communications network, or (ii) a provider of a public electronic communications service; and “public electronic communications network” and “public electronic communications service” have the meaning given in section 151 of the Communications Act 2003(1); [from that act: “public electronic communications network” means an electronic communications network provided wholly or mainly for the purpose of making electronic communications services available to members of the public; “public electronic communications service” means any electronic communications service that is provided so as to be available for use by members of the public;]

[2g] – “traffic data” means data processed for the purpose of the conveyance of a communication on an electronic communications network or for the billing in respect of that communication and includes data relating to the routing, duration or time of a communication;
[2h] – “user ID” means a unique identifier allocated to persons when they subscribe to or register with an internet access service or internet communications service.

[3] These Regulations apply to communications data if, or to the extent that, the data are generated or processed in the United Kingdom by public communications providers in the process of supplying the communications services concerned.

As more and more online services start to look at what data they may be able to collect about their users, it’s maybe worth bearing in mind the extent to which they are a “public electronic communications service” and any proposed legislation they may have to conform to.

As and when this draft bill is announced formally, I think it could provide a good opportunity for a wider discussion about the ethics of communications/paradata collection and use.

PS Although it’s unlikely to get very far, I notice that a Private Member’s Bill on Online Safety was introduced last week with the intention to Make provision about the promotion of online safety; to require internet service providers and mobile phone operators to provide a service that excludes pornographic images; and to require electronic device manufacturers to provide a means of filtering content where “electronic device” means a device that is capable of connecting to an internet access service and downloading content.
On “Engineering”…

I’ve been pondering what is is to be an engineer, lately, in the context of trying to work out what it is that I actually do and what sort of “contract” I feel I’m honouring (and with whom) by doing whatever that is that spend my days doing…

According to Wikipedia, [t]he term engineering … deriv[es] from the word engineer, which itself dates back to 1325, when an engine’er (literally, one who operates an engine) originally referred to “a constructor of military engines.” … The word “engine” itself is of even older origin, ultimately deriving from the Latin ingenium (c. 1250).

Via Wiktionary, [e]ngine originally meant ‘ingenuity, cunning’ which eventually developed into meaning ‘the product of ingenuity, a plot or snare’ and ‘tool, weapon’. Engines as the products of cunning, then, and hence, naturally, war machines. And engineers as their operators, or constructors.

One of the formative books in my life (mid-teens, I think) was Richard Gregory’s Mind in Science, from which I took away the idea of tools as things that embodied and executed an idea. You see a way of doing something or how to do something, and then put that idea into an artefact – a tool – that does it. Code is a particularly expressive medium in this respect, AI (in the sense of Artificial Intelligence) one way of explicitly trying to give machines ideas, or embody mind in machine. (I have an AI background – my PhD in evolutionary computation was pursued in a cognitive science unit (HRCL, as was) at the OU; what led me to “AI”, I think, was a school of thought relating to the practice of how to use code to embody mind and natural process in machines, as well as how to use code that can act on, and be acted on by, the physical world.)

So part of what I (think I) do is build tools, executable expressions of ideas. I’m not so interested in how they are used. I’ve also started sketching maps a lot, lately, of social networks and other things that can be represented as graphs. These are tools too – macroscopes for peering at structural relationships within a system – and again, once produced, I’m not so interested in how they’re used. (What excites me is finding the process that allows the idea to be represented or executed.)

If we go back to the idea of “engineer”, and dig a little deeper by tracing the notion of ingenium, we find this take on it:

ingenium is the original and natural faculty of humans; it is the proper faculty with which we achieve certain knowledge. It is original because it is the first “facility” young people untouched by prejudices exemplify upon seeing similarities between disparate things. It is natural because it is to us what the power to create is to God. just as God easily begets a world of nature, so we ingeniously make discoveries in the sciences and artifacts in the arts. Ingenium is a productive and creative form of knowledge. It is poietic in the creation of the imagination; it is rhetorical in the creation of language, through which all sciences are formalized. Hence, it requires its own logic, a logic that combines both the art of finding or inventing arguments and that of judging them. Vico argues that topical art allows the mind to locate the object of knowledge and to see it in all its aspects and not through “the dark glass” of clear and distinct ideas. The logic of discovery and invention which Vico uses against Descartes’s analytics is the art of apprehending the true. With this Vico come full circle in his arguments against Descartes. [From the Introduction by L.M. Palmer to Vico on Ingenium, in Giambattista Vico: On the Most Ancient Wisdom of the Italians. Trans. L.M. Palmer. London: Cornell University Press, 1988. 31-34, 96-104. Originally published 1710.]

And for some reason, at first reading, that brings me peace…

…which I shall savour on a quick dog walk. I wonder if the woodpecker will be out in the woods today?

Structured Data for Course Web Pages and Customised Custom Search Engine Sorting

As visitors to any online shopping site will know, it’s often possible to sort search query results by price, or number of ‘review stars’, or filter items to show only books by a specified author, or publisher, for example. Via Phil Bradley, I see it’s now possible to introduce custom filtering and sorting elements into Google Custom Search Engine results.

(If you’re not familiar with Google’s Custom Search Engines (CSE), they’re search engines that only search over, or prioritise results from, a limited set of web pages/web domains. Google CSEs power my Course Detective and UK University Libraries search engines. (Hmm… I suspect Course Detective has rotted a bit by now…:-(

What this means is that if web pages are appropriately marked up, they can be sorted, filterd or ranked accordingly when returned as a search result in a Google CSE. So for example, if course pages were marked up with academic level, start date, NSS satisfaction score, or price, they could be sorted along those lines.

So how do pages need to be marked up in order to benefit from this feature? There are several ways:

  • Simply add meta-tags to a web page. For example, <meta name=”course.identifier” content=”B203″ />
  • using Rich Snippets supporting markup (i.e. microdata/microformats/RDFa)
  • As PageMap data added to a sitemap, or webpage. PageMap data also allows for the definition of actions, such as “Download”, that can be emphasised as such within a custom search result. (Facebook is similarly going down the path of trying to encourage developers to use verb driven, action related semantics (Facebook Actions))

I wonder about the extent to which JISC’s current course data programme of activities could be used to encourage institutions to explore the publication of some of their course data in this way? For example, might it be possible to transform XCRI feeds such as the Open University XCRI feed, into PageMap annotated sitemaps?

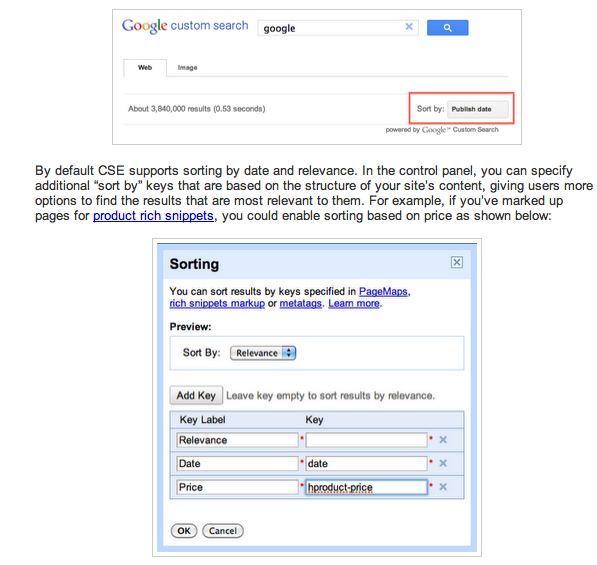
Something like a tweaked Course Detective CSE could then act as a quick demonstrator of what benefits can be immediately realised? So for example, from the Google CSE documentation on Filtering and sorting search results (I have to admit I haven’t played with any of this yet…), it seems that as well as filtering results by attribute, it’s also possible to use them to filter and rank (or at least, bias) results:

Not to self: have a rummage around the XCRI data definitions/vocabularies resources… I also wonder if there is a mapping of XCRI elements onto simple attribute names that could be used to populate eg meta tag or PageMap name attributes?

Viewing OpenLearn Mindmaps Using d3.js

In a comment on Generating OpenLearn Navigation Mindmaps Automagically, Pete Mitton hinted that the d3.js tree layout example might be worth looking at as a way of visualising hierarchical OpenLearn mindmaps/navigation layouts.

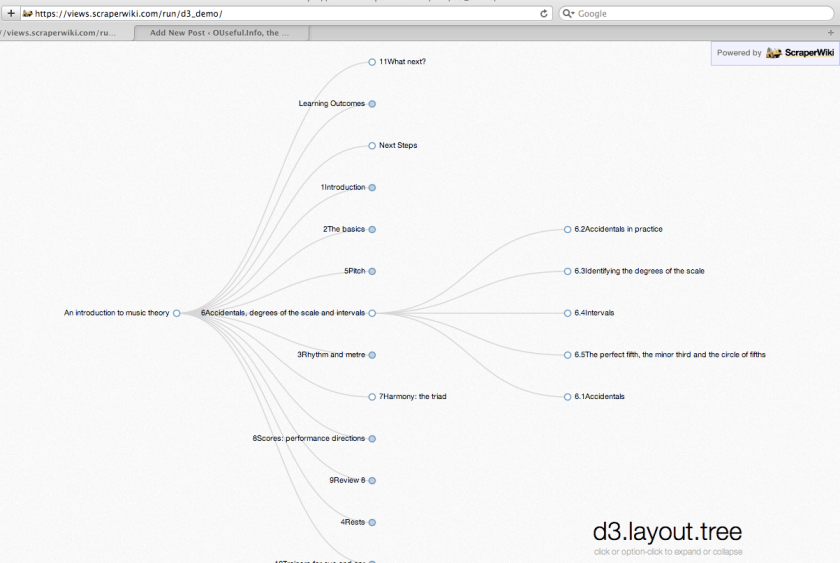
It just so happens that there is a networkx utility that can publish a tree structure represented as a networkx directed graph in the JSONic form that d3.js works with (networkx.readwrite.json_graph), so I had a little play with the code I used to generate Freemind mind maps from OpenLearn units and refactored it to generate a networkx graph, and from that a d3.js view:

(The above view is a direct copy of Mike Bostock’s example code, feeding from an automagically generated JSON representation of an OpenLearn unit.)

For demo purposes, I did a couple of views: a pure HTML/JSON view, and a Python one, that throws the JSON into an HTML template.

The d3.js JSON generating code can be found on Scraperwiki too: OpenLearn Tree JSON. When you run the view, it parses the OpenLearn XML and generates a JSON representation of the unit (pass the unit code via a ?ucode=UNITCODE URL parameter, for example https://scraperwiki.com/views/openlearn_tree_json/?unit=OER_1.

The Python powered d3.js view also responds to the unit URL parameter, for example:
https://views.scraperwiki.com/run/d3_demo/?unit=OER_1

The d3.js view is definitely very pretty, although at times the layout is a little cluttered. I guess the next step is a functional one, though, which is to find how to linkify some of the elements so the tree view can act as a navigational surface.

Generating OpenLearn Navigation Mindmaps Automagically

I’ve posted before about using mindmaps as a navigation surface for course materials, or as way of bootstrapping the generation of user annotatable mindmaps around course topics or study weeks. The OU’s XML document format that underpins OU course materials, including the free course units that appear on OpenLearn, makes for easy automated generation of secondary publication products.

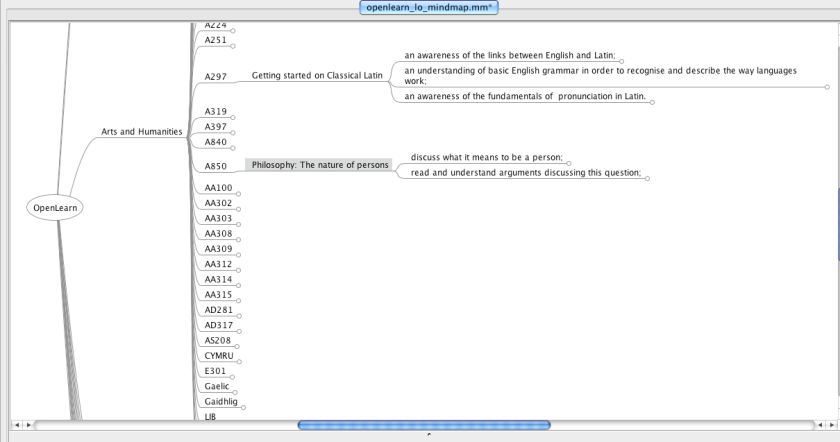
So here’s the next step in my exploration of this idea, a data sketch that generates a Freemind .mm format mindmap file for a range of OpenLearn offerings using metadata puled into Scraperwiki. The file can be downloaded to your desktop (save it with a .mm suffix), and then opened – and annotated – within Freemind.

You can find the code here: OpenLearn mindmaps.

By default, the mindmap will describe the learning outcomes associated with each course unit published on the Open University OpenLearn learning zone site.

By hacking the view URL, other mindmaps are possible. For example, we ca make the following additions to the actual mindmap file URL (reached by opening the Scraperwiki view) as follows:

  • ?unit=UNITCODE, where UNITCODE= something like T180_5 or K100_2 and you will get a view over section headings and learning outcomes that appear in the corresponding course unit.
  • ?unitset=UNITSET where UNITSET= something like T180 or K100 – ie the parent course code from which a specific unit was derived. This view will give a map showing headings and Learning Outcomes for all the units derived from a given UNITSET/course code.
  • ?keywordsearch=KEYWORD where KEYWORD= something like: physics This will identify all unit codes marked up with the keyword in the RSS version of the unit and generate a map showing headings and Learning Outcomes for all the units associated with the keyword. (This view is still a little buggy…)

In the first iteration, I haven’t added links to actual course units, so the mindmap doesn’t yet act as a clickable navigation surface, but that it is on the timeline…

It’s also worth noting that there is a flash browser available for simple Freemind mindmaps, which means we could have an online, in-browser service that displays the mindmap as such. (I seem to have a few permissions problems with getting new files onto ouseful.open.ac.uk at the moment – Mac side, I think? – so I haven’t yet been able to demo this. I suspect that browser security policies will require the .mm file to be served from the same server as the flash component, which means a proxy will be required if the data file is pulled from the Scraperwiki view.)

What would be really nice, of course, would be an HTML5 route to rendering a JSONified version of the .mm XML format… (I’m not sure how straightforward it would be to port the original Freemind flash browser Actionscript source code?)

Twitter Volume Controls

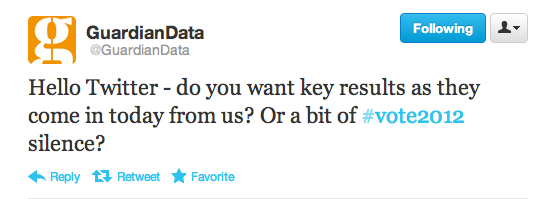
With a steady stream of tweets coming out today containing local election results, @GuardianData (as @datastore was recently renamed) asked whether or not regular, stream swamping updates were in order:

A similar problem can occur when folk are livetweeting an event – for a short period, one or two users can dominate a stream with a steady outpouring of live tweets.

Whilst I’m happy to see the stream, I did wonder about how we could easily wrangle a volume control, so here are a handful of possible approaches:

  • Tweets starting @USER ... are only seen in the stream of people following both the sender of the tweet and @USER. So if @GuardianData set up another, non-tweeting, account, @GuardianDataBlitz, and sent election results to that account (“@GuardianDataBlitz Mayor referendum results summary: Bradford NO (55.13% on ), Manchester NO (53.24%), Coventry NO (63.58%), Nottingham NO (57.49%) #vote2012” for example), only @GuardianData followers following @GuardianDataBlitz would see the result. There are a couple of problems with this approach, of course: for one, @GuardianDataBlitz takes up too many characters (although that can be easily addressed), but more significantly it means that most followers of @GuardianData will miss out on the data stream. (They can be expected to necessarily know about the full fat feed switch.)
  • For Twitter users using a Twitter client that supports global filtering of tweets across all streams within a client, we may be able to set up a filter to exclude tweets of the form (@GuardianData AND #vote2012). This is a high maintenance approach, though, and will lead to the global filter getting cluttered over time, or at least requiring maintenance.
  • The third approach – again targeted at folk who can set up global filters – is for @GuardianData to include a volume control in their tweets, eg Mayor referendum results summary: Bradford NO (55.13% on ), Manchester NO (53.24%), Coventry NO (63.58%), Nottingham NO (57.49%) #vote2012 #blitz. Now users can set a volume control by filtering out terms tagged #gblitz. To remind people that they have a volume filter in place, @GuardianData could occasionally post blitz items with #inblitz to show folk who have the filter turned on what they’re missing? Downsides to this approach are that it pollutes the tweets with more confusing metadata maybe confuses folk about what hashtag is being used.
  • A more generic approach might be to use a loudness indicator or channel that can be filtered against, so for example channel 11: ^11 or ^loud (reusing the ^ convention that is used to identify individuals tweeting on a team account)? Reminders to folk who may have a volume filter set could take the form ^on11 or ^onloud on some of the tweets? Semantic channels might also be defined: ^ER (Election Results), ^LT (Live Tweets) etc, again with occasional reminders to folk who’ve set filters (^onLT, etc, or “We’re tweeting local election results on the LT ^channel today”)). Again, this is a bit of a hack that’s only likely to appeal to “advanced” users and does require them to take some action; I guess it depends whether the extra clutter is worth it?

So – any other volume control approaches I’ve missed?

PS by the by, here’s a search query (just for @daveyp;-) that I’ve been using to try to track results as folk tweet them:

-RT (#atthecount OR #vote2012 OR #le2012) AND (gain OR held OR los OR hold) AND (con OR lib OR lab OR ukip)

I did wonder about trying to parse out ward names to try an automate the detection of possible results as they appeared in the stream, but opted to go to bed instead! It’s something I could imagine trying to work up on Datasift, though…

Sketching Sponsor Partners Running UK Clinical Trials

Using data from the clinicaltrials.gov registry (search for UK clinical trials), I grabbed all records relating to trials that have at least in part run in the UK as an XML file download, then mapped links between project lead sponsors and their collaborators. Here’s a quick sketch of the result:

ukClinicalTrialPartners (PDF)

The XML data schema defines the corresponding fields as follows:

<!-- === Sponsors ==================================================== -->

  <xs:complexType name="sponsors_struct">
    <xs:sequence>
      <xs:element name="lead_sponsor" type="sponsor_struct"/>
      <xs:element name="collaborator" type="sponsor_struct" minOccurs="0" maxOccurs="unbounded"/>
    </xs:sequence>
  </xs:complexType>

Here’s the Python script I used to extract the data and generate the graph representation of it (requires networkx), which I then exported as a GEXF file that could be loaded into Gephi and used to generate the sketch shown above.

import os
from lxml import etree
import networkx as nx
import networkx.readwrite.gexf as gf
from xml.etree.cElementTree import tostring


def flatten(el):
	if el != None:
		result = [ (el.text or "") ]
		for sel in el:
			result.append(flatten(sel))
			result.append(sel.tail or "")
		return "".join(result)
	return ''

def graphOut(DG):
	writer=gf.GEXFWriter(encoding='utf-8',prettyprint=True,version='1.1draft')
	writer.add_graph(DG)
	#print tostring(writer.xml)
	f = open('workfile.gexf', 'w')
	f.write(tostring(writer.xml))

def sponsorGrapher(DG,xmlRoot,sponsorList):
	sponsors_xml=xmlRoot.find('.//sponsors')
	lead=flatten(sponsors_xml.find('./lead_sponsor/agency'))
	if lead !='':
		if lead not in sponsorList:
			sponsorList.append(lead)
			DG.add_node(sponsorList.index(lead),label=lead,name=lead)
			
	for collab in sponsors_xml.findall('./collaborator/agency'):
		collabname=flatten(collab)
		if collabname !='':
			if collabname not in sponsorList:
				sponsorList.append(collabname)
				DG.add_node( sponsorList.index( collabname ), label=collabname, name=collabname, Label=collabname )
			DG.add_edge( sponsorList.index(lead), sponsorList.index(collabname) )
	return DG, sponsorList

def parsePage(path,fn,sponsorGraph,sponsorList):
	fnp='/'.join([path,fn])
	xmldata=etree.parse(fnp)
	xmlRoot = xmldata.getroot()
	sponsorGraph,sponsorList = sponsorGrapher(sponsorGraph,xmlRoot,sponsorList)
	return sponsorGraph,sponsorList

XML_DATA_DIR='./ukClinicalTrialsData'
listing = os.listdir(XML_DATA_DIR)

sponsorDG=nx.DiGraph()
sponsorList=[]
for page in listing:
	if os.path.splitext( page )[1] =='.xml':
		sponsorDG, sponsorList = parsePage(XML_DATA_DIR,page, sponsorDG, sponsorList)

graphOut(sponsorDG)

Once the file is loaded in to Gephi, you can hover over nodes to see which organisations partnered which other organisations, etc.

One thing the graph doesn’t show directly are links between co-collaborators – edges go simply from lead partner to each collaborator. It would also be possible to generate a graph that represents pairwise links between every sponsor of a particular trial.

The XML data download also includes information about the locations of trials (sometimes at the city level, sometimes giving postcode level data). So the next thing I may look at is a map to see where sponsors tend to runs trials in the UK, and maybe even see whether different sponsors tend to favour different trial sites…

Further down the line, I wonder whether any linkage can be made across to things like GP practice level prescribing behaviour, or grant awards from the MRC?

PS these may be handy too – World Health Organisation Clinical Trials Registry portal, EU Clinical Trials Register

PPS looks like we can generate a link to the clinicaltrials.gov download file easily enough. Original URL is:
http://clinicaltrials.gov/ct2/results?cntry1=EU%3AGB&show_flds=Y&show_down=Y#down
Download URL is:
http://clinicaltrials.gov/ct2/results/download?down_stds=all&down_typ=study&down_flds=shown&down_fmt=plain&cntry1=EU%3AGB&show_flds=Y&show_down=Y
So now I wonder: can Scraperwiki accept a zip file, unzip it, then parse all the resulting files? Answers, with code snippets, via the comments, please:-) DONE – example here: Scraperwiki: clinicaltrials.gov test

Doodling With a Conversation, or Retweet, Data Sketch Around LAK12

How can we represent conversations between a small sample of users, such as the email or SMS converstations between James Murdoch’s political lobbiest and a Government minister’s special adviser (Leveson inquiry evidence), or the pattern of retweet activity around a couple of heavily retweeted individuals using a particular hashtag?

I spent a bit of time on-and-off today mulling over ways of representing this sort of interaction, in search of something like a UML call sequence diagram but not, and here’s what I came up with in the context of the retweet activity:

The chart looks a bit complicated at first, but there’s a lot of information in there. The small grey dots on their own are tweets using a particular hashtag that aren’t identified as RTs in a body of tweets obtained via a Twitter search around a particular hashtag (that is, they don’t start with a pattern something like RT @[^:]*:). The x-axis represents the time a tweet was sent and the y-axis who sent it. Paired dots connected by a vertical line segment show two people, one of whom (light grey point) retweeted the other (dark grey point). RTs of two notable individuals are highlighted using different colours. The small black dots highlight original tweets sent by the individuals who we highlight in terms of how they are retweeted. Whilst we can’t tell which tweet was retweeted, we may get an idea of how the pattern of RT behaviour related to the individuals of interest plays out relative to when they actually tweeted.

Here’s the R-code used to build up the chart. Note that the order in which the layers are constructed is important (for example, we need the small black dots to be in the top layer).

##RT chart, constructed in R using ggplot2
require(ggplot2)
#the base data set - exclude tweets that aren't RTs
g = ggplot(subset(tw.df.rt,subset=(!is.na(rtof))))
#Add in vertical grey lines connecting who RT'd whom
g = g + geom_linerange(aes(x=created,ymin=screenName,ymax=rtof),colour='lightgrey')
#Use a more complete dataset to mark *all* tweets with a lightgrey point
g = g + geom_point(data=(tw.df),aes(x=created,y=screenName),colour='lightgrey')
#Use points at either end of the RT line segment to distinguish who RTd whom
g = g + geom_point(aes(x=created,y=screenName),colour='lightgrey') + geom_point(aes(x=created,y=rtof),colour='grey') + opts(axis.text.y=theme_text(size=5))
#We're going to highlight RTs of two particular individuals
#Define a couple of functions to subset the data
subdata.rtof=function(u) return(subset(tw.df.rt,subset=(!is.na(rtof) & rtof==u)))
subdata.user=function(u) return(subset(tw.df.rt,subset=(!is.na(rtof) & screenName==u)))
#Grab user 1
s1='gsiemens'
ss1=subdata.rtof(s1)
ss1x=subdata.user(s1)
sc1='aquamarine3'
#Highlight the RT lines associated with RTs of this user
g = g + geom_linerange(data=ss1,aes(x=created,ymin=screenName,ymax=rtof),colour=sc1)
#Grab user 2
s2='busynessgirl'
ss2=subdata.rtof(s2)
ss2x=subdata.user(s2)
sc2='orange'
#Highlight the RT lines associated with RTs of this user
g = g + geom_linerange(data=ss2,aes(x=created,ymin=screenName,ymax=rtof),colour=sc2)
#Now we add another layer to colour the nodes associated with RTs of the two selected users
g = g + geom_point(data=ss1,aes(x=created,y=rtof),colour=sc1) + geom_point(data=ss1,aes(x=created,y=screenName),colour=sc1)
g = g + geom_point(data=ss2,aes(x=created,y=rtof),colour=sc2) + geom_point(data=ss2,aes(x=created,y=screenName),colour=sc2)
#Finally, add a highlight to mark when the RTd folk we are highlighting actually tweet
g = g + geom_point(data=(ss1x),aes(x=created,y=screenName),colour='black',size=1)
g = g + geom_point(data=(ss2x),aes(x=created,y=screenName),colour='black',size=1)
#Print the chart
print(g)

One thing I’m not sure about is the order of names on the y-axis. That said, one advantage of using the conversational, exploratory visualisation data approach that I favour is that if you let you eyes try to seek out patterns, you may be able to pick up clues for some sort of model around the data that really emphasises those patterns. So for example, looking at the chart, I wonder if there would be any merit in organising the y-axis so that folk who RTd orange but not aquamarine were in the bottom third of the chart, folk who RTd aqua but not orange were in the top third of the chart, folk who RTd orange and aqua were between the two users of interest, and folk who RTd neither orange nor aqua were arranged closer to the edges, with folk who RTd each other close to each other (invoking an ink minimisation principle)?

Something else that it would be nice to do would be to use the time an original tweet was sent as the x-axis value for the tweet marker for the original sender of a tweet that is RTd. We would then get a visual indication of how quickly a tweet was RTd.

PS I also created a script that generated a wealth of other charts around the lak12 hashtag [PDF]. The code used to generate the report can be found as the file exampleSearchReport.Rnw in this code repository.

Feeding on OU/BBC Co-Produced Content (Upcoming and Currently Available on iPlayer)

What feeds are available listing upcoming broadcasts of OU/BBC co-produced material or programmes currently available on iPlayer?

One of the things I’ve been pondering with respect to my OU/BBC programmes currently on iPlayer demo and OU/BBC co-pros upcoming on iPlayer (code) is how to start linking effectively across from programmes to Open University educational resources.

Chatting with KMi’s Mathieu d’Aquin a few days ago, he mentioned KMi were looking at ways of automating the creation of relevant semantic linkage that could be used to provide linkage between BBC programmes and OU content and maybe feed into the the BBC’s dynamic semantic publishing workflow.

In the context of OU and BBC programmes, one high level hook is the course code. Although I don’t think these feeds are widely promoted as a live service yet, I did see a preview(?) of an OU/BBC co-pro series feed that includes linkage options such as related course code (one only? Or does the schema allow for more than one linked course?) and OU nominated academic (one only? Or does the schema allow for more than one linked academic? More than one), as well as some subject terms and the sponsoring Faculty:

  <item>
    <title><![CDATA[OU on the BBC: Symphony]]></title>
    <link>http://www.open.edu/openlearn/whats-on/ou-on-the-bbc-history-the-symphony</link>
    <description><![CDATA[Explore the secrets of the symphony, the highest form of expression of Western classical music]]></description>
    <image title="The Berrill Building">http://www.open.edu/openlearn/files/ole/ole_images/general_images/ou_ats.jpg</image>
    <bbc_programme_page_code>b016vgw7</bbc_programme_page_code>
    <ou_faculty_reference>Music Department</ou_faculty_reference>
    <ou_course_code>A179</ou_course_code>
    <nominated_academic_oucu></nominated_academic_oucu>
    <transmissions>
        <transmission>
            <showdate>21:00:00 24/11/2011</showdate>
            <location><![CDATA[BBC Four]]></location>
            <weblink></weblink>
        </transmission>
        <transmission>
            <showdate>19:30:00 16/03/2012</showdate>
            <location><![CDATA[BBC Four]]></location>
            <weblink></weblink>
        </transmission>
        <transmission>
            <showdate>03:00:00 17/03/2012</showdate>
            <location><![CDATA[BBC Four]]></location>
            <weblink></weblink>
        </transmission>
        <transmission>
            <showdate>19:30:00 23/03/2012</showdate>
            <location><![CDATA[BBC Four]]></location>
            <weblink></weblink>
        </transmission>
        <transmission>
            <showdate>03:00:00 24/03/2012</showdate>
            <location><![CDATA[BBC Four]]></location>
            <weblink></weblink>
        </transmission>
    </transmissions>
     <comments>http://www.open.edu/openlearn/whats-on/ou-on-the-bbc-history-the-symphony#comments</comments>
 <category domain="http://www.open.edu/openlearn/whats-on">What's On</category>
 <category domain="http://www.open.edu/openlearn/tags/bbc-four">BBC Four</category>
 <category domain="http://www.open.edu/openlearn/tags/music">music</category>
 <category domain="http://www.open.edu/openlearn/tags/symphony">symphony</category>
 <pubDate>Tue, 18 Oct 2011 10:38:03 +0000</pubDate>
 <dc:creator>mc23488</dc:creator>
 <guid isPermaLink="false">147728 at http://www.open.edu/openlearn</guid>
  </item>

I’m not sure what the guid is? Nor do there seem to be slots for links to related OpenLearn resources other than the top link element? However, the course code does provide a way into course related educational resources via data.open.ac.uk, the nominated academic link may provide a route to associated research interests (for example, via ORO, the OU open research repository), the BBC programme code provides a route in to the BBC programme metadata, and the category tags may provide other linkage somewhere depending on what vocabulary gets used for specifying categories!

I guess I need to build myself a little demo to se what we can do with a fed of this sort..?!;-)

I’m not sure if plans are similarly afoot to publish BBC programme metadata actual the actual programme instance (“episode”) level? It’s good to see that the OpenLearn What’s On feed has been tidied up little to include title elements, although it’s still tricky to work out what the feed is actually of?

For example, here’s the feed I saw a few days ago:

 <item>
    <title><![CDATA[OU on the BBC: Divine Women  - 9:00pm 25/04/2012 - BBC Two and BBC HD]]></title>
    <link>http://www.open.edu/openlearn/whats-on/ou-on-the-bbc-divine-women</link>
    <description><![CDATA[Historian Bettany Hughes reveals the hidden history of women in religion, from dominatrix goddesses to feisty political operators and warrior empresses&nbsp;]]></description>
    <location><![CDATA[BBC Two and BBC HD]]></location>
	<image title="The Berrill Building">http://www.open.edu/openlearn/files/ole/ole_images/general_images/ou_ats.jpg</image>
    <showdate>21:00:00 25/04/2012</showdate>
     <pubDate>Tue, 24 Apr 2012 11:19:10 +0000</pubDate>
 <dc:creator>sb26296</dc:creator>
 <guid isPermaLink="false">151446 at http://www.open.edu/openlearn</guid>
  </item>

It contains an upcoming show date for programmes that will be broadcast over the next week or so, and a link to a related page on OpenLearn for the episode, although no direct information about the BBC programme code for each item to be broadcast.

In the meantime, why not see what OU/BBC co-pros are currently available on iPlayer?

Or for a bitesize videos, how about this extensive range of clips from OU/BBC co-pros?

Enjoy! :-)

Local and Sector Specific Data Verticals

Although a wealth of public data sets are being made available by government departments and local bodies, it can often be hard to track down. Data.gov.uk maintains an index of a wide variety of publicly released datasets, and more can be found via data released under FOI requests, either made through WhatDoTheyKnow or via a web search of government websites for FOI disclosure logs. But now it seems that interest may be picking up in making data available in more palatable ways…

Take for example datagenerator, “an online service designed to help individuals and businesses in the creative sector to access the latest industry research and analysis” operated by Creative & Cultural Skills, the sector skills council for the UK’s creative and cultural industries:

This tool allows you search through – and select – data from a variety of sources and generate a range of tabulated data reports, or visual charts based on the datasets you have selected. It’ll be interesting to see whether or note this promotes uptake/use of the data made available via the service? That is, maybe the first step towards uptake of data at scale (rather than by developers for app development, for example), is the provision of tools that allow the creation of reports and dashboards?

If the datagenerator approach is successful, I wonder if it would help with uptake of data and research made available via the DCMS CASE programme?

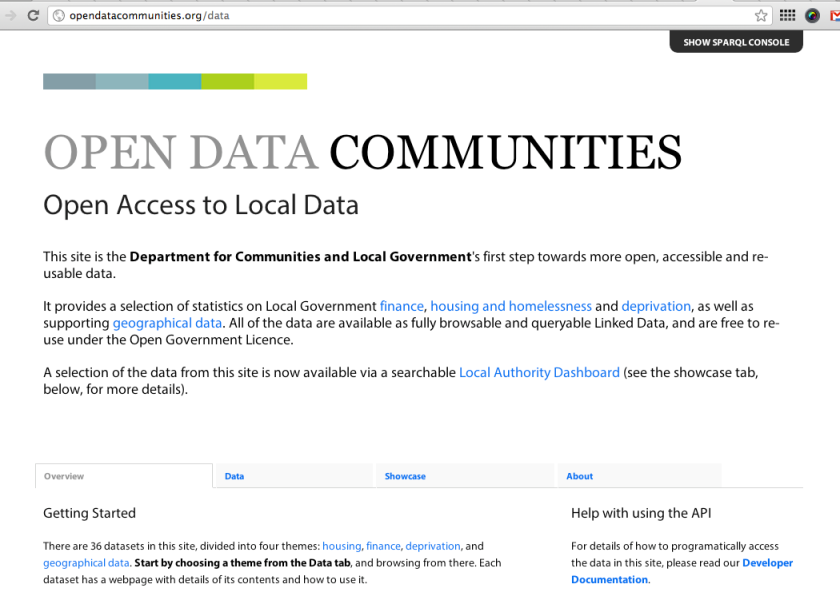
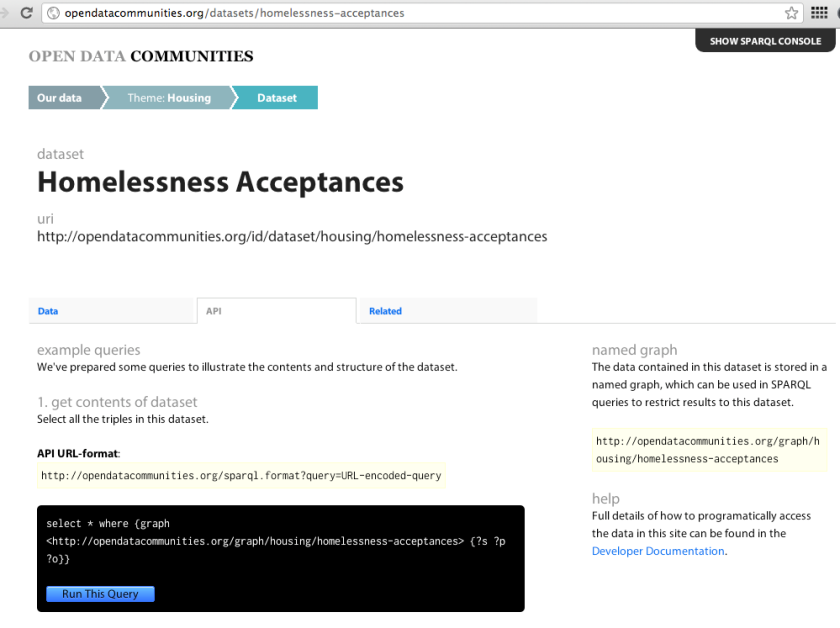
Or how about OpenDataComminites, which is trying to make Linked Data published via DCLG a little more palatable.

There’s still a little way to go before this becomes widely used though, I suspect?

But it’s a good start, and just needs some way of allowing folk to share more useful queries now and maybe hide them under a description of what sorts of result they (are supposed to?!) return.

Data powered services

As the recent National Audit Office report on Implementing Transparency reminds us, the UK Government’s transparency agenda is driving the release of public data not only for the purposes of increased accountability and improving services, but also with the intention of unlocking or realising value associated with datasets generated or held by public bodies. In this respect, it is interesting to see how data sets are also being used to power services at a local level, improving service provision for citizens at the same time.

In Putting Public Open Data to Work…?, I reviewed several data related services built on top of data released at a local level that might also provide the basis for a destination site at a national level based on a aggregation of the locally produced data. Two problems immediately come to mind in this respect. Firstly, identifying where (or indeed, if) the local data can be found; secondly, normalising the data. Even if 10 councils nominally publish the same sort of dataset, it’s likely that the data will be formatted or published in 11 or more different ways!

(Note that for local government data, one way of tracking down data sets is to use the Local Government Service IDs to identify web pages relating to the service of interest: for example, Aggregated Local Government Verticals Based on LocalGov Service IDs.)

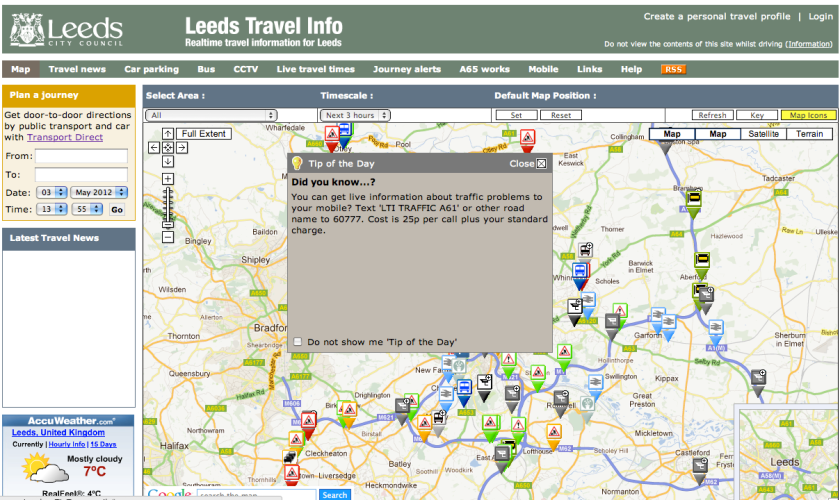
Here’s a (new to me) example of one such service in the transport domain – Leeds Travel Info

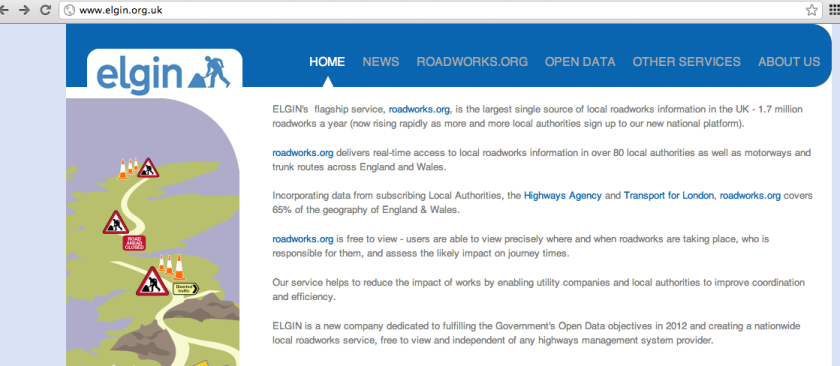
Another traffic related site shows how it may be possible to build a sustainable, national service on top of aggregated public data, offering benefits back to local councils as well as to members of the public: operated by Elgin, roadworks.org aggregates roadworks related data fom across the UK and makes it avaiable via a user facing site as well as an API.

The various Elgin articles provide an interesting starting point, I think, for anyone who’s considering building a service that may benefit local government service provision and citizens alike based around open data.

ELGIN is the trading name of Roadworks Information Limited, a new company established in 2011 to take over the stewardship of roadworks.org (formerly http://www.elgin.gov.uk).
ELGIN has been established specifically to realize the Government’s vision of opening up local transport data by December 2012 (see Prime Minister’s statement 7th July and the Chancellor’s Autumn statement November 2011.)

ELGIN is dedicated to preserving the free-to-view national roadworks portal and extending its range of Open Data services throughout the Intelligent Transport and software communities.

roadworks.org is a free-to-view web based information service which publishes current and planned roadworks fulfilling the requirements of members of the public wanting quick information on roadworks and providing a data rich environment for traffic management professionals and utility companies.

[ELGIN supports the roadworks.org local roadworks portal by the providing services to local authority and utility clients and through subscriptions from participating local authorities. Though a private company, ELGIN manages roadworks.org and adheres to public sector standards of governance and a commitment to free and open data.]

Our policies and development strategy are strongly influenced by our Subscribers and governed by a governance regime appropriate to our role serving the public sector.

We are committed to helping achieve better coordination of roadworks, and in working together with all stakeholders to realise the vision of open, accessible, timely and accurate roadworks information.

[ELGIN redistributes public sector information under the Open Government Licence and provides its added value aggregation and application services to industry via its easy to use API (Application Programme Interface).]

Another application I quite like is YourTaximeter, This service scrapes and interprets local regulations in a contextually meaningful way, in this case locally set Hackney Carriage (taxi) fares:

If you know of any other local data or local legislation powered apps that are out there, please feel free to add a link in the comments, and I’ll maybe do a round up of anything that turns up;-)