The Chart Equivalent of Comic Sans..?

Whilst looking at the apparently conflicting results from a couple of recent polls by YouGov on press regulation (reviewed in a piece by me over on OpenLearn: Two can play at that game: When polls collide in support of a package on the OU/BBC co-produced Radio 4 programme, More Or Less), my eye was also drawn to the different ways in which the survey results were presented graphically.

The polls were commissioned by The Sun newspaper on the one hand, and the Media Standards Trust/Hacked Off on the other. If you look at the poll data (The Sun/YouGov [PDF] and Media Standards Trust/YouGov [PDF] respectively), you’ll see that it’s reported in a standard format. (I couldn’t find actual data releases, but the survey reports look as if they are generated in a templated way, so getting the core of a generic scraper together for them shouldn’t be too difficult…) But how was that represented to readers (text based headlines and commentary aside?

Here are a couple of grabs from the Sun’s story (State-run watchdog ‘will gag free press’):

Pie-charts in 3D, with a tilt… gorgeous… erm, not… And the colour choice for the bar chart inner-column text is a bit low on contrast compared to the background, isn’t it?

It looks a bit like the writer took a photo of the print edition of the story on their phone, uploaded it and popped it into the story, doesn’t it?

I guess credit should be given for keeping the risk responses separate in the second image, when they could have just gone for the headline figures as pulled out in the YouGov report:

So what I’m wondering now is the extent to which a chart’s “theme” or style reflects the authority or formal weight we might ascribe to it, in much the same way as different fonts carry different associations? Anyone remember the slating that CERN got for using Comic Sans in their Higgs-Boson discovery announcement (eg here, here or here)?

Things could hardly have been more critical if they had used CrappyGraphs or an XKCD style chart generator (as for example described in Style your R charts like the Economist, Tableau … or XKCD ; or alternatively, XKCD-style for matplotlib).

XKCD - Science It works [XKCD]

Oh, hang on a minute, it almost looks like they did!

Anyway – back to the polls. The Media Standards Trust reported on their poll using charts that had a more formal look about them:

The chart annotations are also rather clearer to read.

So what, if anything, do we learn from this? That maybe you need to think about chart style, in the same way you might consider your font selection. From the R charts like the Economist, Tableau … or XKCD post, we also see that some of the different applications we might use to generate charts have their own very distinctive, and recognisable, style (as do many Javascript charting libraries). A question therefore arises about the extent to which you should try to come up with your own distinctive (but still clear) style that fits the tone of your communication, as well as its context and in sympathy with any necessary branding or house styling.

PS with respect to the Sun’s copyright/syndication notice, and my use of the images above:

I haven’t approached the copyright holders seeking permission to reproduce the charts here, but I would argue that this piece is just working up to being research into the way numerical data is reported, as well as hinting at criticism and review. So there…

PPS As far as bad charts go, they may also be, misrepresentations and underhand attempts at persuasion, graphic style, are also possible, as SimplyStatistics describes: “The statisticians at Fox News use classic and novel graphical techniques to lead with data” [ The statisticians at Fox News use classic and novel graphical techniques to lead with data ] See also: OpenLearn – Cheating with Charts.

More Shiny Goodness – Tinkering With the Ergast Motor Racing Data API

I had a bit of a play with Shiny over the weekend, using the Ergast Motor Racing Data API and the magical Shiny library for R, that makes building interactive, browser based applications around R a breeze.

As this is just a quick heads-up/review post, I’ll largely limit myself to a few screenshots. When I get a chance, I’ll try to do a bit more of a write-up, though this may actually just take the form of more elaborate documentation of the app, both within the code and in the form of explanatory text in the app itself.

If you want to try ou the app, you can find an instance here: F1 2012 Laptime Explorer. The code is also available.

Here’s the initial view – the frist race of the season is selected as a default and data loaded in. The driver list is for all drivers represented during the season.

f1 2012 shiny ergast explorer

THe driver selectors allow us to just display traces for selected drivers.

The Race History chart is a classic results chart. It show the difference between the race time to date for each driver, by lap, compared to the average lap time for the winner times the lap number. (As such, this is an offline statistic – it is calculated when the winner’s overall average laptime is known).

race hisotry - classic chart

Variants of the classic Race History chart are possible, for example, using different base line times, but I haven’t implemented any of them – or the necessary UI controls. Yet…

The Lap Chart is another classic:

Lap chart - another classic

Annotations for this chart are also supported, describing all drivers who final status was not “Finished”.

lap chart with annotations

The Lap Evolution chart shows how each driver’s laptime evolved over the course of the race compared with the fastest overall recorded laptime.

Lap evolution

The Personal Lap Evolution chart shows how each driver’s laptime evolved over the course of the race compared with their personal fastest laptime.

Personal lap evolution

The Personal Deltas Chart shows the difference between one laptime and the next for each driver.

Personal deltas

The Race Summary Chart is a chart of my own design that tries to capture notable features relating to race position – the grid position (blue circle), final classification (red circle), position at the end of the first lap (the + or horizontal bar). The violin plot shows the distribution of how many laps the driver spent in each race position. Where the chart is wide, the driver spent a large number of laps in that position.

race summary

The x-axis ordering pulls out different features about how the race progressed. I need to add in a control that lets the user select different orderings.

Finally, the Fast Lap text scatterplot shows the fastest laptime for each driver and the lap at which they recorded it.

fastlaps

So – that’s a quick review of the app. All in all it took maybe 3 hours getting my head round the data parsing, 2-3 hours figuring what I wanted to do and learning how to do it in Shiny, and a couple of hours doing it/starting to document/annotate it. Next time, it’ll be much quicker…

Emergent Social Interest Mapping – Red Bull Racing Facebook Group

With the possibility that my effectively unlimited Twitter API key will die at some point in the Spring with the Twitter API upgrade, I’m starting to look around for alternative sources of interest signal (aka getting ready to say “bye, bye, Twitter interest mapping”). And Facebook groups look like they may offer once possibility…

Some time ago, I did a demo of how to map the the common Facebook Likes of my Facebook friends (Social Interest Positioning – Visualising Facebook Friends’ Likes With Data Grabbed Using Google Refine). In part inspired by a conversation today about profiling the interests of members of particular Facebook groups, I thought I’d have a quick peek at the Facebook API to see if it’s possible to grab the membership list of arbitrary, open Facebook groups, and then pull down the list of Likes made by the members of the group.

As with my other social positioning/social interest mapping experiments, the idea behind this approach is broadly this: users express interest through some sort of public action, such as following a particular Twitter account that can be associated with a particular interest. In this case, the signal I’m associating with an expression of interest is a Facebook Like. To locate something in interest space, we need to be able to detect a set of users associated with that thing, identify each of their interests, and then find interests they have in common. These shared interests (ideally over and above a “background level of shared interest”, aka the Stephen Fry effect (from Twitter, where a large number of people in any set of people appear to follow Stephen Fry oblivious of other more pertinent shared interests that are peculiar to that set of people) are then assumed to be representative of the interests associated with the thing. In this case, the thing is a Facebook group, the users associated with the thing are the group members, and the interests associated with the thing are the things commonly liked by members of the group.

Simples.

So for example, here is the social interest positioning of the Red Bull Racing group on Facebook, based on a sample of 3000 members of the group. Note that a significant number of these members returned no likes, either because they haven’t liked anything, or because their personal privacy settings are such that they do not publicly share their likes.

rbr_fbGroup_commonLikes

As we might expect, the members of this group also appear to have an interest in other Formula One related topics, from F1 in general, to various F1 teams and drivers, and to motorsport and motoring in general (top half of the map). We also find music preferences (the cluster to the left of the map) and TV programmes (centre bottom of the map) that are of common interest, though I have no idea yet whether these are background radiation interests (that is, the Facebook equivalent of the Stephen Fry effect on Twitter) or are peculiar to this group. I’m not sure whether the cluster of beverage related preferences at the bottom right corner of the map is notable either?

This information is visualised using Gephi, using data grabbed via the following Python script (revised version of this code as a gist):

#This is a really simple script:
##Grab the list of members of a Facebook group (no paging as yet...)
###For each member, try to grab their Likes

import urllib,simplejson,csv,argparse

#Grab a copy of a current token from an example Facebook API call, eg from clicking a keyed link on:
#https://developers.facebook.com/docs/reference/api/examples/
#Something a bit like this:
#AAAAAAITEghMBAOMYrWLBTYpf9ciZBLXaw56uOt2huS7C4cCiOiegEZBeiZB1N4ZCqHgQZDZD

parser = argparse.ArgumentParser(description='Generate social positioning map around a Facebook group')

parser.add_argument('-gid',default='2311573955',help='Facebook group ID')
#gid='2311573955'

parser.add_argument('-FBTOKEN',help='Facebook API token')

args=parser.parse_args()
if args.gid!=None: gid=args.gid
if args.FBTOKEN!=None: FBTOKEN=args.FBTOKEN

#Quick test - output file is simple 2 column CSV that we can render in Gephi
fn='fbgroupliketest_'+str(gid)+'.csv'
writer=csv.writer(open(fn,'wb+'),quoting=csv.QUOTE_ALL)

uids=[]

def getGroupMembers(gid):
	gurl='https://graph.facebook.com/'+str(gid)+'/members?limit=5000&access_token='+FBTOKEN
	data=simplejson.load(urllib.urlopen(gurl))
	if "error" in data:
		print "Something seems to be going wrong - check OAUTH key?"
		print data['error']['message'],data['error']['code'],data['error']['type']
		exit(-1)
	else:
		return data

#Grab the likes for a particular Facebook user by Facebook User ID
def getLikes(uid,gid):
	#Should probably implement at least a simple cache here
	lurl="https://graph.facebook.com/"+str(uid)+"/likes?access_token="+FBTOKEN
	ldata=simplejson.load(urllib.urlopen(lurl))
	print ldata
	
	if len(ldata['data'])>0:	
		for i in ldata['data']:
			if 'name' in i:
				writer.writerow([str(uid),i['name'].encode('ascii','ignore')])
				#We could colour nodes based on category, etc, though would require richer output format.
				#In the past, I have used the networkx library to construct "native" graph based representations of interest networks.
				if 'category' in i: 
					print str(uid),i['name'],i['category']

#For each user in the group membership list, get their likes				
def parseGroupMembers(groupData,gid):
	for user in groupData['data']:
		uid=user['id']
		writer.writerow([str(uid),str(gid)])
		#x is just a fudge used in progress reporting
		x=0
		#Prevent duplicate fetches
		if uid not in uids:
			getLikes(user['id'],gid)
			uids.append(uid)
			#Really crude progress reporting
			print x
			x=x+1
	#need to handle paging?
	#parse next page URL and recall this function


groupdata=getGroupMembers(gid)
parseGroupMembers(groupdata,gid)

Note that I have no idea whether or not this is in breach of Facebook API terms and conditions, nor have I reflected on the ethical implications of running this sort of analysis, over and the above remarking that it’s the same general approach I apply to mapping social interests on Twitter.

As to where next with this? It brings into focus again the question of identifying common interests pertinent to this particular group, compared to background popular interest that might be expressed by any random set of people. But having got a new set of data to play with, it will perhaps make it easier to test the generalisability of any model or technique I do come up with for filtering out, or normalising against, background interest.

Other directions this could go? Using a single group to bootstrap a walk around the interest space? For example, in the above case, trying to identify groups associated with Sebastian Vettel, or F1, and then repeating the process? It might also make sense to look at the categories of the notable shared interests; (from a quick browse, these include, for example, things like Movie, Product/service, Public figure, Games/toys, Sports Company, Athlete, Interest, Sport; is there a full vocabulary available, I wonder? How might we use this information?)

Mapping Primary Care Trust (PCT) Data, Part 1

The launch or official opening or whatever it was of the Open Data Institute this week provided another chance to grab a snapshot of notable folk in the community, as for example demonstrated by people commonly followed by users of the #ODIlaunch hashtag on Twitter. The PR campaign also resulted in the appearance of some open data related use cases, such as a report in the Economist about an analysis by MastodonC and Prescribing Analytics mapping prescription charges (R code available), with a view to highlighting where prescriptions for branded, as opposed to the recommended generic, drugs are being issued at wasteful expense to the NHS. (See Exploring GP Practice Level Prescribing Data for some of my entry level doodlings with prescription data.)

Quite by chance, I’ve been looking at some other health data recently, (Quick Shiny Demo – Exploring NHS Winter Sit Rep Data), which has been a real bundle of laughs. Looking at a range of health related datasets, data seems to be published at a variety of aggregation levels – individual practices and hospitals, Primary Care Trusts (PCTs), Strategic Health Authorities (SHAs) and the new Clinical Commissioning Groups (CCGs). Some of these map on to geographical regions, that can then be coloured according to a particular measure value associated with that area.

I’ve previously experimented with rendering shapefiles and choropleth maps (Amateur Mapmaking: Getting Started With Shapefiles) so I know R provides one possible environment for generating these maps, so I thought I’d try to pull together a recipe or two for supporting the creation of thematic maps based on health related geographical regions.

A quick trawl for PCT shapefiles turned up nothing useful. @jenit suggested @mastodonc, and @paulbradshaw pointed me to a dataset on Google Fusion Tables, discovered through the Fusion Tables search engine, that included PCT geometry data. So no shapefiles, but there is exportable KML data from Fusion Tables.

At this point I should have followed Paul Bradshaw’s advice, and just uploaded my own data (I was going to start out with mapping per capita uptake of dental services by PCT) to Fusion Tables, merging with the other data set, and generating my thematic maps that way.

But that wasn’t quite the point, which was actually an exercise in pulling together an R based recipe for generating these maps…

Anyway, I’ve made a start, and here’s the code I have to date:

##Example KML: https://dl.dropbox.com/u/1156404/nhs_pct.kml
##Example data: https://dl.dropbox.com/u/1156404/nhs_dent_stat_pct.csv

install.packages("rgdal")
library(rgdal)
library(ggplot2)

#The KML data downloaded from Google Fusion Tables
fn='nhs_pct.kml'

#Look up the list of layers
ogrListLayers(fn)

#The KML file was originally grabbed from Google Fusion Tables
#There's only one layer...but we still need to identify it
kml=readOGR(fn,layer='Fusiontables folder')

#This seems to work for plotting boundaries:
plot(kml)

#And this:
kk=fortify(kml)
ggplot(kk, aes(x=long, y=lat,group=group))+ geom_polygon()

#Add some data into the mix
#I had to grab a specific sheet from the original spreadsheet and then tidy the data little...
nhs <- read.csv("nhs_dent_stat_pct.csv")

kml@data=merge(kml@data,nhs,by.x='Name',by.y='PCT.ONS.CODE')

#I think I can plot against this data using plot()?
plot(kml,col=gray(kml@data$A.30.Sep.2012/100))
#But is that actually doing what I think it's doing?!
#And if so, how can experiment using other colour palettes?

#But the real question is: HOW DO I DO COLOUR PLOTS USING gggplot?
ggplot(kk, aes(x=long, y=lat,group=group)) #+ ????

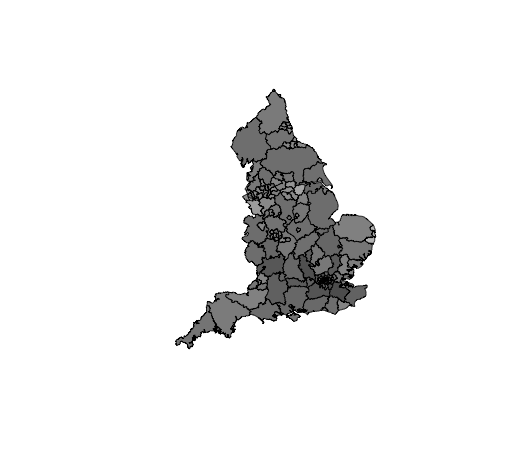
Here’s what an example of the raw plot looks like:

plot_pct

And the greyscale plot, using one of the dental services uptake columns:

thematicPlot_pct

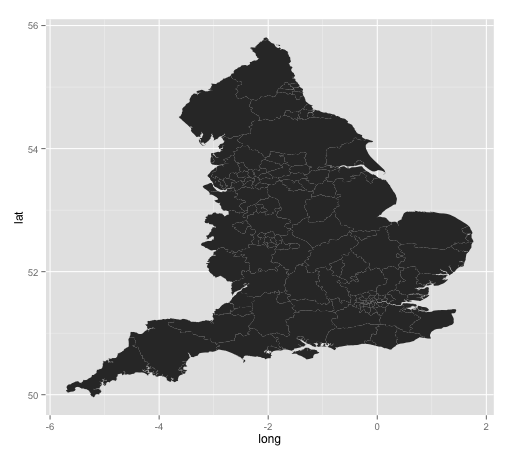
Here’s the base ggplot() view:

ggplot_pctMap

However, I don’t know how to actually now plot the data into the different areas? (Oh – might this help? CRAN Task View: Analysis of Spatial Data.)

If you know how to do the colouring, or ggplotting, please leave a comment, or alternatively, chip in an answer to a related question I posted on StackOverflow: Plotting Thematic Maps from KML Data Using ggplot2

Thanks:-)

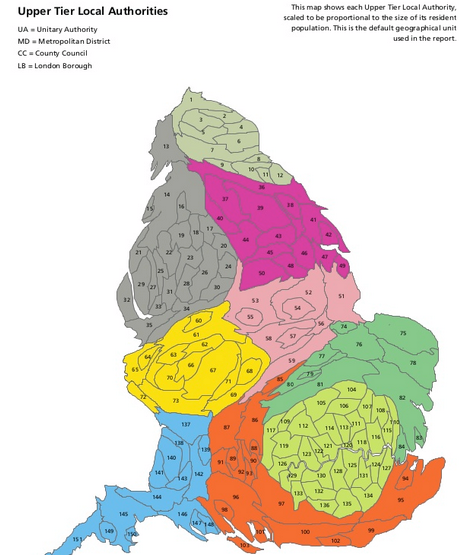
PS The recent Chief Medical Officer’s Report makes widespread use of a whole range of graphical devices and charts, including cartograms:

CMO cartogram

Is there R support for cartograms yet, I wonder?! (Hmmm… maybe?)

PPS on the public facing national statistics front, I spotted this job ad yesterday – Head of Rich Content Development, ONS:

The postholder is responsible for inspiring and leading development of innovative rich content outputs for the ONS website and other channels, which anticipate and meet user needs and expectations, including those of the Citizen User. The role holder has an important part to play in helping ONS to realise its vision “for official statistics to achieve greater impact on key decisions affecting the UK and to encourage broader use across the country”.

Key Responsibilities:

1.Inspires, builds, leads and develops a multi-disciplinary team of designers, developers, data analysts and communications experts to produce innovative new outputs for the ONS website and other channels.
2. Keeps abreast of emerging trends and identifies new opportunities for the use of rich web content with ONS outputs.
3. Identifies new opportunities, proposes new directions and developments and gains buy in and commitment to these from Senior Executives and colleagues in other ONS business areas.
4. Works closely with business areas to identify, assess and commission new rich-content projects.
5. Provides, vision, guidance and editorial approval for new projects based on a continual understanding of user needs and expectations.
6. Develops and manages an ongoing portfolio of innovative content, maximising impact and value for money.
7. Builds effective partnerships with media to increase outreach and engagement with ONS content.
8. Establishes best practice in creation of rich content for the web and other channels, and works to improve practice and capability throughout ONS.

Interesting…

Hack Days and Megagames – Time for a “Fantasy Tax Avoidance League”?

With the recent brouhaha around corporate tax wheezes, I wonder – can we may a fantasy tax league style game out of it?

A year or two year after I graduated, I shared a house with, amongst others, an active wargamer, which meant that every so ofter the living room table was turned over to a miniature battlefield. These weren’t just games, of course: I seem to recall one of our regular visitors had some sort of link to the University of Bradford Peace Studies group, where I imagine playing out conflict situations in game-like settings is useful experimental device. One big idea I picked up on was the notion of a megagame, (I think in the context of one of the regular players taking part in one, maybe even this one? Operation Market Garden 2, Montgomery Wing, Army Staff College, Sandhurst, 25 Sept, 1993, 128 participants).

Megagames are “multi-player historical simulation game, in which the participants are organised into teams, and those teams into an hierarchy of teams” [about]. The most recent one – Urban Nightmare – Crisis in a modern city, considers an urban crisis (which may or may not include the sort of zombie attack, the preparedness for which local councils are regularly FOI’d: Derby, Nov 2012, Lincoln, August 2012, Leicester, June 2011. Only Bristol, July 2011 appears to have it covered;-) For other examples, search for zombie on WhatDoTheyKnow. Bear in mind that if you put in such a request yourself, that’s £50 (or however much…) or so of your council task you’ve just squandered.)

Councils and government run preparedness exercises and “serious games” on a regular basis, of course, both in terms of real world crises (search for council emergency exercise site:bbc.co.uk for examples), as well as online incidents: Steph Gray’s Social Simulator, for example, allows you to ask “How would your team handle social media in a crisis?” and then play out the response in closed environment (anyone remember Argyll and Bute…)

In certain respects, hack days resemble the notion of a megagame, although the focus is not so much on playing out a particular event based scenario as trying to ‘play out” some of the possibilities of a datacentric one. (A good example of this might be the upcoming NHS Hackday.)

The recent public outcry over the way in which global corporates play the international tax system to minimise their global tax spend, spawned by the appearance of Google, Starbucks and Amazon at the Public Accounts Committee, led to the announce of tax avoidance handling measures in the Autumn Statement – Anti-Avoidance and Evasion (press release, Ministerial statement, background).

I’m sure the HMRC plays out its proposed tax changes behind closed doors, trying to pre-empt the machinations of the corporate accountants hell bent on minimising tax expenditure, but I’ve been wondering: how about setting up a “Fantasy Tax League” or “Fantasy Tax Hack” Game, where players are given a notional global corporate to play with, and a lousy tax situation, along with a whole bunch of (real) tax law with the aim of showing just how much tax spend they can save by tweaking the corporate structure and accounting lines.

Such a game might resemble “fantasy fund” or “fantasy portfolio” challenges, or things like the Daily Telegraph’s A Better’s Way to Invest fantasy spread-betting demonstration, which just happens to feature an ongoing commentary by the OU Business School’s Professor Fenton-O’Creevy.

Bonus point would be awarded for the most complex corporate structures imagined:

The game would be open to all-comers, from the big accounting and consultancy firms, acting in their own name (with corporate logos to identify them in the current results table), as well as tax gamers and armchair auditors (who apparently aren’t engaging with Government online data). The requirements of the game that each participant publish their corporate structures, tax avoidance and efficiency schemes in order to prove how much they have saved the notional company.

Of course, there’s always the danger that by gaming tax law in public, tax laws will be changed at an ever increasing rate, turning the whole thing into some sort nomic like metagame, where the government changes rules on the one hand, and the accountants provide ‘as-if’ rule changes by finding alternative interpretations to regulations than the ones intended by the parliamentary drafters…

PS via John Battelle’s blog, this informal description of the Double Irish Dutch Sandwich multinational corporate tax avoiding structure for licensing on IP from favourable tax domains into ever less favourable tax domains.

All I Did Was Go to a Carol Service…

Christmas Tree day, and though it’s not decorated yet, at least it’s up. The screws in the trusty metal base had rusted a little since Twelfth Night last year, but a pair of pliers and a dab of engine from the mower dipstick seemed to do the trick in loosening them; then it was time to go off to the “Lights of Love” Carol Service in aid of the local hospice at the Church in our old parish.

(A similar service in the local pub missed last week.)

The drive, a little bit longer than usual: temporary traffic lights set up around a hole in the road – gas leak, apparently.

I’ve never visited the Island’s hospice (Earl Mountbatten was the governor, then first Lord Lieutenant, years ago), but it seems they’ve recently opened a wifi enable café; must check it out some time…

Carols sung, community choir, coffee and a mince pie. Shop bought, not Mothers’ Union home made. Illness put the refreshments in doubt, homebaking too? Had I known, maybe I should have brought some of mine. Or maybe not.

Chat with the town Mayor, (sounds grand, doesn’t it?! Longstanding friend.). Remembrance. Surprise declared about my lack of engagement, on civil liberties grounds, about a recent action by the Isle of Wight Council, the police, and representatives of the DWP – Department of Work and Pensions – involving the stopping of cars at commuter time and drivers (presumably just drivers?) consequently “quizzed about their National Insurance numbers, who their employers were and who they lived” [src]. (The story so far… Crackdown on bad driving and aftershock ‘Big Brother’ criticism of operation. The council leader also had a response: Tories hit back at criticism of benefits operation/Cllr Pugh: IW Conservatives support Police/DWP Benefit vehicle stops).

Home. Remains of chicken from yesterday’s roast, fried with bacon. Melted butter, flour, roux. Milk. White sauce. Add the meat, almost cooked farfalle, seasoning. Sorted.

All I did was go to a carol service. Now this: department work pensions question suspected fraud

Interesting – the Power of FOI: [p]lease would you be able to provide me with a copy of the procedure and guidance followed by the DWP fraud investigators where there is suspected fraud.

dwp fraud docs

Not everything.

too much fraud

Fraudsters driving? Clampdown?

fraud drive

Joint working.

joint working

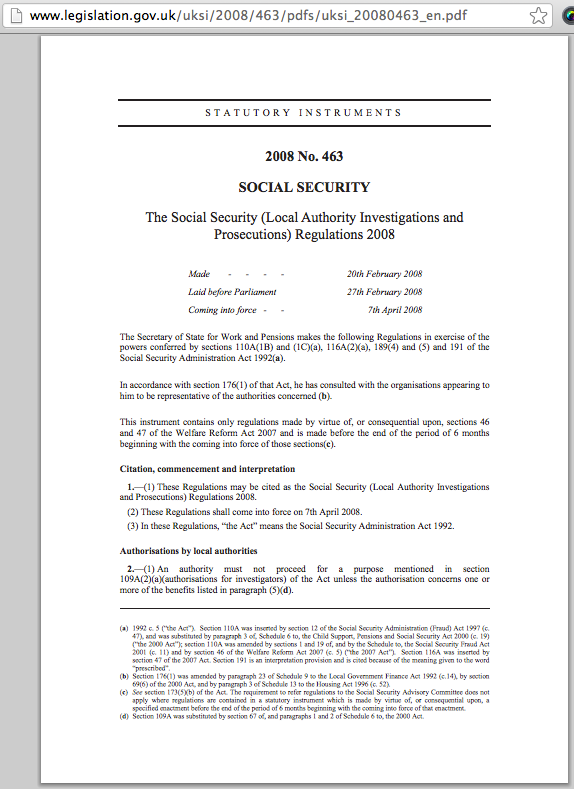
Sections 46 and 47 of Welfare Reform Act 2007. Legislation.

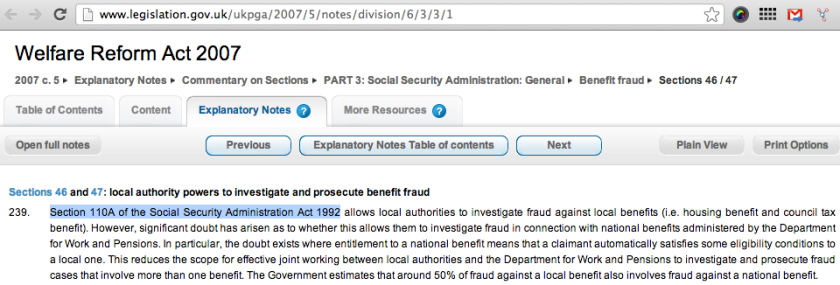
Explanatory Notes are often a good place to start. Almost readable.

wlefare reform act 2007 notes

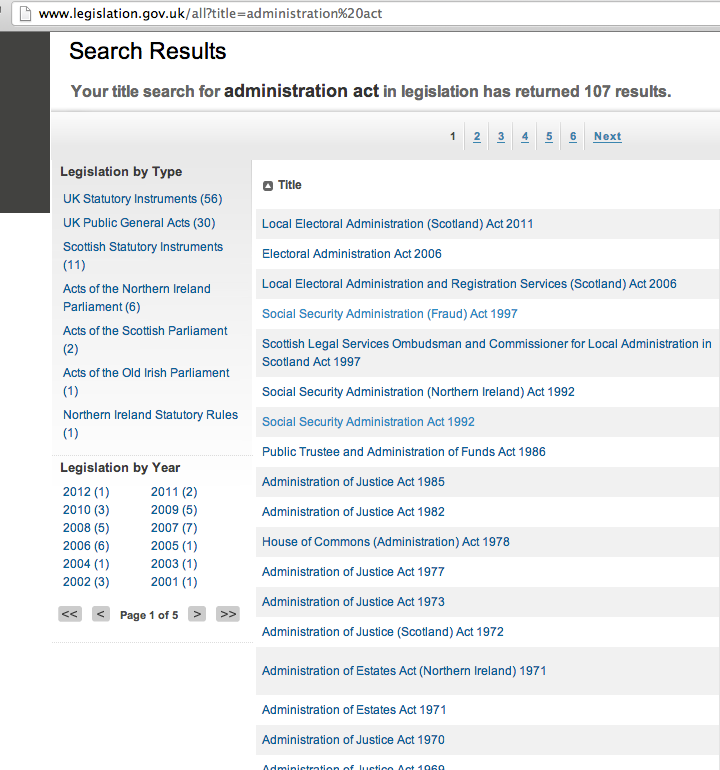
Rat hole… Section 110A. Administration Act. Which Administration Act?

administration act

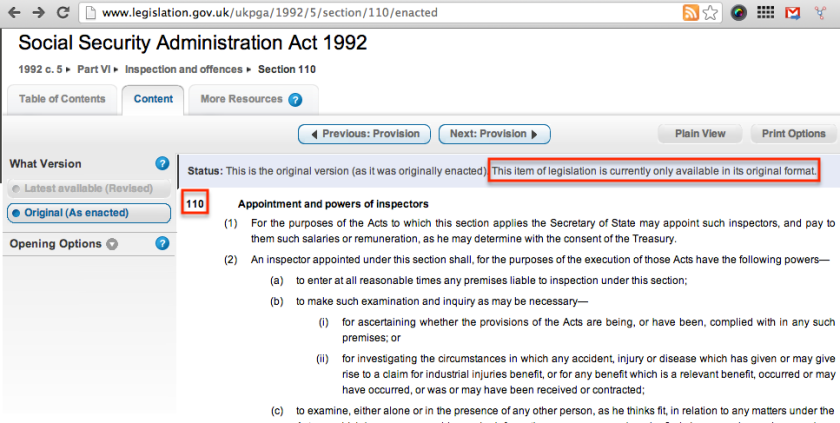
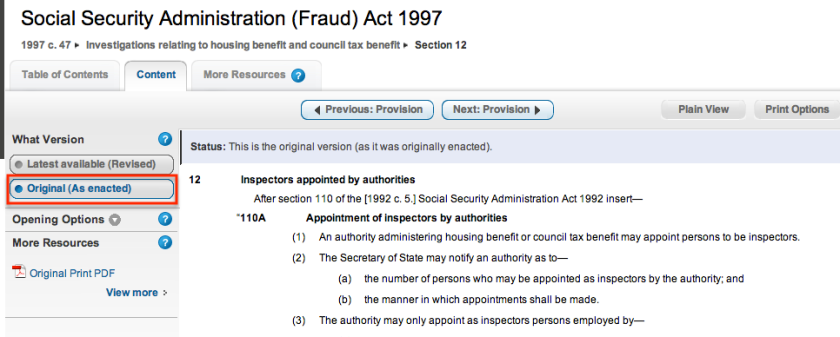
Ah – this one:

Original form

Original form only. No amended section (paragraph?) 110. No 110A.

Google. /Social Security Administration 110A/

amended - no original

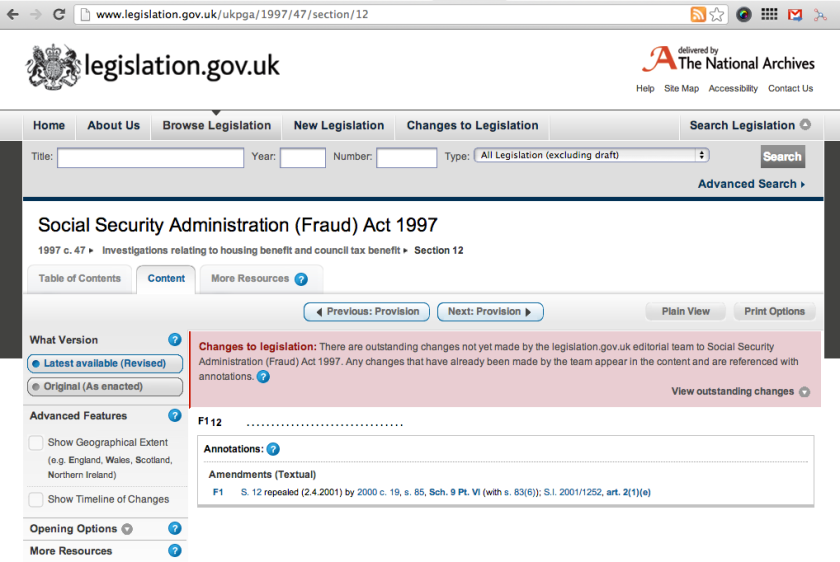
Amendments to 110A. But no 110A?

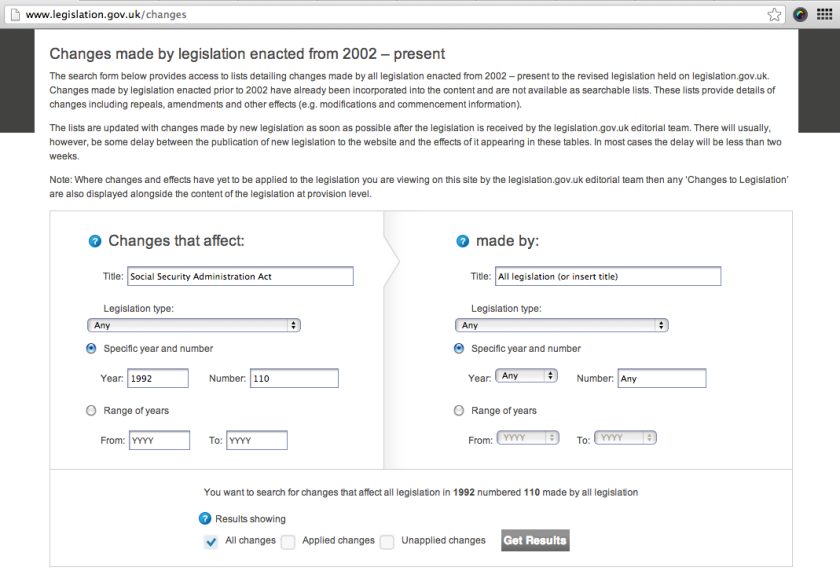
Changes.

changes

Searching…

searching for changes

(Ooh – RSS change feed. Could be handy…)

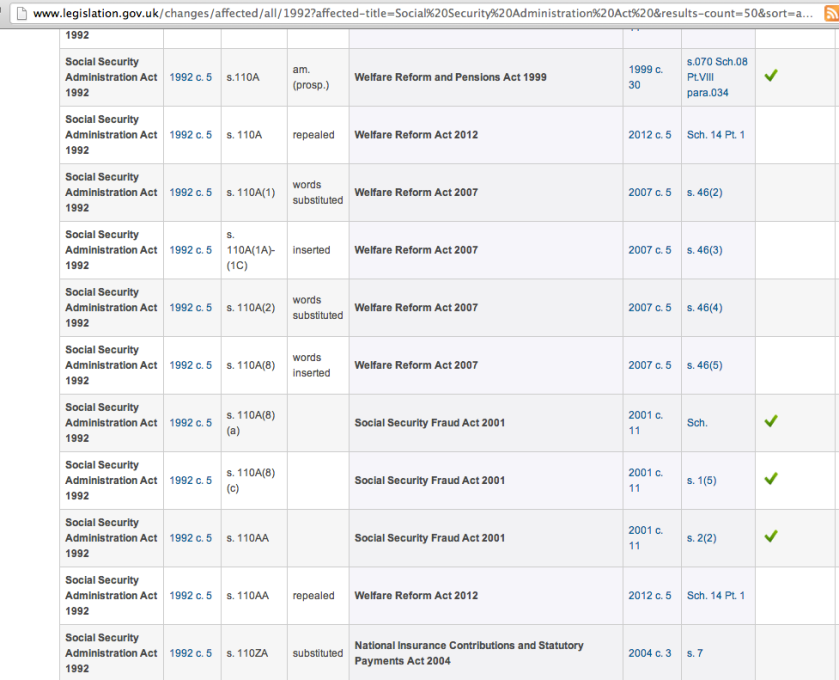
Scroll.

amended

Thanks, John. (John’s bringing legislation up to date and on to the web. Give the man an honour.)

Click the links, in anticipation of the 110A, as introduced. No joy.

Google. Again. Desperate. Loose search. /site:legislation.gov.uk 110A/

fragment

Enough of a clue.

SI footnote

Cmd-f on a Mac (ctrl-f on Windows). Footnote. Small print.

footnote

That looks like a likely candidate…

gone

Gone. Amended out of existence. Replaced.

Maybe that’s why I could only find amendments to 110A. It may not be current, but I’m intrigued. How was it originally enacted?

original enactment

All I did was go to a carol service. All I want to do is be informed about what powers Local Authorities and the DWP have with respect to “quizzing” citizens stopped apparently at random. I just want to be an informed citizen: what powers were available to the Isle of Wight Council and the DWP a week or two ago?

So I’ve tracked down the original 110A, but so what? It’s not currently enacted, is it? That was a sidetrack. An aside. What does 110A allow today, bearing in mind it’s due for repeal (and possibly, prior to that, subject to as yet uncommenced further amendments)?

I guess I could pay a subscription to a legal database to more directly look up the state of the law. (Only I probably wouldn’t have to pay – .ac.uk credential and all that. Member of an academic library and the attendant privileges that go with it. Lessig found that, in a medical context. 11 minutes in. Because. BECAUSE. $435 to you. But then… Table 4. That’s with the privilege of .edu or .ac.uk library access. That’s with the unpaid work of academics running the journals, providing the editorial review services, handing over copyrights (that they possibly handed over to their institutions anyway…) to publishers for free – only not; at public expense, for publicly funded academics and researchers. And for the not-insignificant profit line of the (commercial) academic publishers. As Monbiot suggests.)

But that wouldn’t be right, would it? Ignorance of the law may not be a defence, but it can’t be right that to find out the law I need to pay for access? The legislation.gov.uk team are doing a great job, but as I’m starting to find, the law is oh, so messy, and it needs to be posted right. But I believe that they will get it up to date and they *will* get it all there. (At least give the man an honour when it’s there…)

So where was I? 110A. Going round in circles, or is it a spiral..? Back at s. 46 of the Welfare Reform Act 2007 (sections 46 and 47 of the Welfare Reform Act, as mentioned in the guidance notes on the National Fraud Partnership Agreement).

So what does the legislation actually say?

welfare reform 2007

Right – so now I’m totally confused. This has been repealed.. but the repeal has not yet commenced? What’s this s. 109A rathole? And what’s Welfare Reform Act 2012 all about?

All I did was go to a carol service. And all I want to find out is the bit of legislation that describes the powers the local council and the DWP were acting under when they were “quizzing” motorists a couple of weeks ago.

So 109A – where can I find 109A? Ah – is this an ‘as currently stands” copy of the Social Security Administration Act 1992 (as amended)?

update

In which case…

109A

And more…

109A-2

But I’m too tired to read it and my battery is about to die. So I’m not really any the wiser.

Nine Lessons form this? Sheesh…

All I did was go to a carol service.

PS why not make a donation to the Earl Mountbatten Hospice? Or your local hospice. In advance.

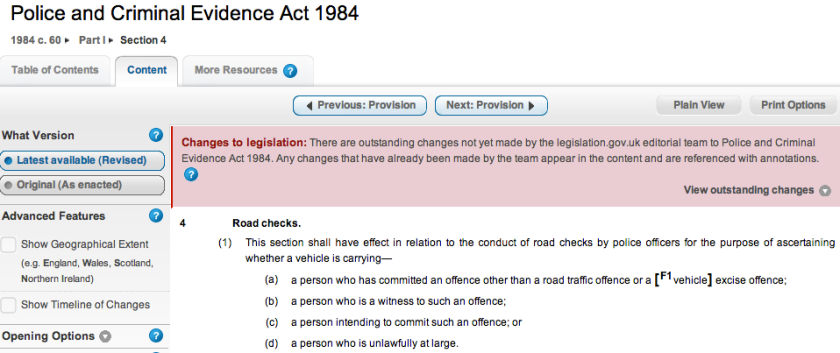
PPS Via @onthewight, a comment link. PACE (Police and Criminal Evidence Act) 1984, s. 4. Road checks.

road check

S.163 of the Road Traffic Act 1988 appears to be the regulation that requires motorists to stop if so directed by a uniformed police or traffic officer.

Now I’m also wondering: as well as the powers available to the DWP and the local council, by what right and under what conditions were cars being stopped by the police and how were they being selected?

#CAST12 DataViz Sandbox – Resources

I had a trip up to London yesterday to give the second of two talks on data visualisation to the #cast12 Masters students at Goldsmiths University. As promised to them, here’s a list of resources they might find useful..:

1) Storytelling with dataHans Rosling demoing Gapminder (using a visualisation technique now often referred to as a motion chart; see the orginal here: Gapminder).

(See also the BBC4 programme fronted by Hans Rosling, “The Joy of Stats”).

How line graphs can narrate a story – Kurt Vonnegut on the Shape of Stories

The Charts’n’things blog, which describes some of the design process that goes on in coming up with some of the great visualisations produced by the New York Times.

2) Google Refine

Google RefineOpenRefine is one of those tools that can make one of the more painful parts of producing visualisations – getting data into a state where you can actually use it – much more manageable. Here are some example use cases:

3) API datagrabs and screenscraping. Here are some handy resources:

4) Gephi tutorials:

5) General.
(Social) network analysis – a theoretical overview: Social Network Analysis – G. Cheliotis.

There are a few extras in there, but anything I missed?

This Week in Open and Communications Data Land…

Following the official opening of the Open Data Institute (ODI) last week, a flurry of data related announcements this week:

Things have been moving on the Communications Data front too. Communications Data got a look in as part of the 2011/2012 Security and Intelligence Committee Annual Report with a review of what’s currently possible and “why change may be necessary”. Apparently:

118. The changes in the telecommunications industry, and the methods being used by people to communicate, have resulted in the erosion of the ability of the police and Agencies to access the information they require to conduct their investigations. Historically, prior to the introduction of mobile telephones, the police and Agencies could access (via CSPs, when appropriately authorised) the communications data they required, which was carried exclusively across the fixed-line telephone network. With the move to mobile and now internet-based telephony, this access has declined: the Home Office has estimated that, at present, the police and Agencies can access only 75% of the communications data that they would wish, and it is predicted that this will significantly decline over the next few years if no action is taken. Clearly, this is of concern to the police and intelligence and security Agencies as it could significantly impact their ability to investigate the most serious of criminal offences.

N. The transition to internet-based communication, and the emergence of social networking and instant messaging, have transformed the way people communicate. The current legislative framework – which already allows the police and intelligence and security Agencies to access this material under tightly defined circumstances – does not cover these new forms of communication. [original emphasis]

Elsewhere in Parliament, the Joint Select Committee Report on the Draft Communications Data Bill was published and took a critical tone (Home Secretary should not be given carte blanche to order retention of any type of data under draft communications data bill, says joint committee. “There needs to be some substantial re-writing of the Bill before it is brought before Parliament” adds Lord Blencathra, Chair of the Joint Committee.) Friend and colleague Ray Corrigan links to some of the press reviews of the report here: Joint Committee declare CDB unworkable.

In other news, Prime Minister David Cameron’s announcement of DNA tests to revolutionise fight against cancer and help 100,000 patients was reported via a technology angle – Everybody’s DNA could be on genetic map in ‘very near future’ [Daily Telegraph] – as well as by means of more reactionary headlines: Plans for NHS database of patients’ DNA angers privacy campaigners [Guardian], Privacy fears over DNA database for up to 100,000 patients [Daily Telegraph].

If DNA is your thing, don’t forget that the Home Office already operates a National DNA Database for law enforcement purposes.

And if national databases are your thing, there always the National Pupil Database which was in the news recently with the launch of a consultation on proposed amendments to individual pupil information prescribed persons regulations which seeks to “maximise the value of this rich dataset” by widening access to this data. (Again, Ray provides some context and commentary: Mr Gove touting access to National Pupil Database.)

PS A late inclusion: DECC announcement around smart meter rollout with some potential links to #midata strategy (eg “suppliers will not be able to use energy consumption data for marketing purposes unless they have explicit consent”). A whole raft of consultations were held around smart metering and Govenerment responses are also published today, including Government Response on Data Access and Privacy Framework, the Smart Metering Privacy Impact Assessment and a report on public attitudes research around smart metering. I also spotted an earlier consultation that had passed me by around the Data and Communications Company (DCC) License Conditions; here the response, which opens with: “The communications and data transfer and management required to support smart metering is to be organised by a new central communications body – the Data and Communications Company (“the DCC”). The DCC will be a new licensed entity regulated by the Gas and Electricity Markets Authority (otherwise referred to as “the Authority”, or “Ofgem”). A single organisation will be granted a licence under each of the Electricity and Gas Acts (there will be two licences in a single document, referred to as the “DCC Licence”) to provide these services within the domestic sector throughout Great Britain”. Another one to put on the reading pile…

Putting a big brother watch hat on, the notion of “meter surveillance” brings to mind BBC article about an upcoming (will hopefully thence be persistently available on iPlayer?) radio programme on “Electric Network Frequency (ENF) analysis”, The hum that helps to fight crime. According to Wikipedia, ENF is a forensic science technique for validating audio recordings by comparing frequency changes in background mains hum in the recording with long-term high-precision historical records of mains frequency changes from a database. In turn, this reminds me of appliance signature detection (identifying what appliance is switched on or off from its electrical load curve signature), for example Leveraging smart meter data to recognize home appliances. In context of audio surveillance, how about supplementing surveillance video cameras with microphones? Public Buses Across Country [US] Quietly Adding Microphones to Record Passenger Conversations.

OU Launches FutureLearn Ltd

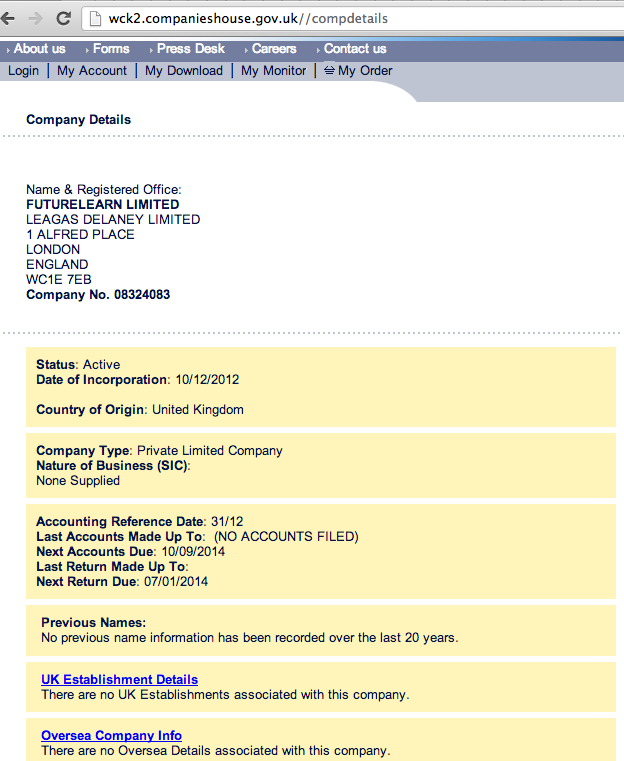
So it seems the Open University press office must have had an embargoed press release lined up for midnight, with a flurry of stories – and a reveal of the official press release on the OU site, partner quotes and briefing doc – about FutureLearn Ltd (Twitter: @future_learn)

Futurelearn Ltd log

Futurelearn original press release

Apparently, Futurelearn (not FutureLearn? The UEA press release uses CamelCase…) “will bring together a range of free, open, online courses from leading UK universities, in the same place and under the same brand.”

A bit like edX, then…?

future of online education

…only that’s for US unis… Or Coursera, which is open to all-comers, I think? Whereas Futurelearn looks as if it’ll be championing the cause of UK universities – apparently, Birmingham [UK universities embrace the free, open, online future of higher education], Bristol [UK universities embrace the free, open, online future of higher education powered by The Open University], Cardiff [Online future of higher education], East Anglia [UK universities embrace the online future of higher education], Exeter [UK universities embrace the free, open, online future of higher education powered by The Open University], King’s College London [Futurelearn – new online higher education initiative], Lancaster [Lancaster signs up for Futurelearn], Leeds [Leeds joins partners in offering free online access to education], Southampton [University of Southampton embraces the open, online future of higher education], St Andrews [news feed] and Warwick [Warwick joins other leading UK universities to create multiple MOOC giving free access to some of those Universities’ most innovative courses] have all signed up to join Futurelearn… (It’ll be interesting to see if HEIs that are trying out Coursera, such as Edinburgh, will joing Futurelearn, or whether exclusive agreements are in place? I also wonder about whether membership of any of the particular university groups will influence which “open” online course marketing outfit particular universities join?) [Other press releases: QAA: Open University launches UK-based Moocs platform]

[For what it’s worth, the OU and UEA were the only press offices to break the story just after midnight. St Andrews is the last to release a press release. Birmingham and Kings were also tardy… I wonder whether some of the partners were waiting to see whether anyone picked up on the story before putting out their own press releases?]

Here’s some of the press coverage so far – I guess I should grab these reports and give each a churnalism score…?

Simon Nelson, whom I remember gave a presentation at the OU a few years ago when he was BBC multiplatform commissioner, has been appointed as CEO, so that could prove interesting… (FWIW, Simon Nelson Linked In page, directorships: Sineo Ltd, and I think Ludifi Ltd?) What might this mean for the OpenLearn brand, I wonder? Or for the Open University Apps, iBooks and Stores?

Structurally, “Futurelearn will be independent but majority-owned by the OU”, although as far as “partners” announced so far go, this “do[es] not constitute a partnership in the legal sense and the Parties shall not have authority to bind each other in any way. The term is used to indicate their support and intent to work together on this project.”

One possible response is that this is a playing out of an Emperor’s New Clothes marketing battle, but as with the evolution of any novel communication technology (seeing “MOOC’s” as such as thing), some of them do manage to lock-in… (And as George Siemens comments in Finally, alternatives to prominent MOOCs, “Even if MOOCs disappear from the landscape in the next few years, the change drivers that gave birth to them will continue to exert pressure and render slow plodding systems obsolete (or, perhaps more accurately, less relevant). If MOOCs are eventually revealed to be a fad, the universities that experiment with them today will have acquired experience and insight into the role of technology in teaching and learning that their conservative peers won’t have. It’s not only about being right, it’s about experimenting and playing in the front line of knowledge”.)

Futurelearn Ltd

Leagas Delaney, it seems, is some sort of brand communications agency. So much style on their website, I couldn’t actually work out the substance of what it is they actually do at this late hour (all I did was check my feeds quickly, just after midnight, as I was on my way to bed, and catch sight of the OU news release…).

PS No-one mention the warUKeU… (via Seb Schmoller (Futurelearn – an OU-led response to Coursera, Udacity, and MITx), I am reminded of Paul Bacsich’s Lessons to be learned from the failure of UKeU.)

PPS Now I’m wondering whether @dkernohan knew something I didn’t when he launched the MOOCAS/”MOOC Advisory Service” search engine a couple of days ago…?!;-)

[UPDATE: this was post was an early response that collated press stories released at end of embargo time. For a more considered review, check out Doug Clow’s Futurelearn may or may not succeed but is well worth a try. Via @dkernohan, William Hammonds on the Universities UK blog: Are we witnessing higher education’s “digital moment”?]

[The views expressed within this post are barley even my personal ones, let alone anybody else’s…]

Organisations Providing Benefits to All-Party Parliamentary Groups, Part 1

Via a tweet from the author, I came across Rob Fenwick’s post on APPGs – the next Westminster scandal? (APPG = All Party Parliamentary Groups):

APPGs are entitled to a Secretariat. Set aside any images you have of a sensibly dressed person of a certain age mildly taking dictation, the provision of an APPG Secretariat is one of the main routes used by public affairs agencies, charities, and businesses to cosey up to MPs and Peers. These “secretaries” often came up with the idea of setting up the group in the first place, to advance the interests of a client or cause.

The post describes some of the organisations that provide secretariat services to APPGs, and in a couple of cases also takes the next step: “Take the APPG on the Aluminium Industry, the secretarial services of which are provided by Aluminium Federation Ltd which is “a not-for-profit organisation.” That sounds suitably reassuring – if the organisation is not-for-profit what chance can there be of big business buying favoured access? It’s only when you look at the Federation’s website, and examine each of its nine sub-associations in turn, that it becomes clear that this not-for-profit organisation is a membership umbrella for private business. This is above board, within the rules, published, and transparent. Transparent if you’re prepared to invest the time to look, of course.”

It’s worth reading the post in full… Go on…

… Done that? Go on.

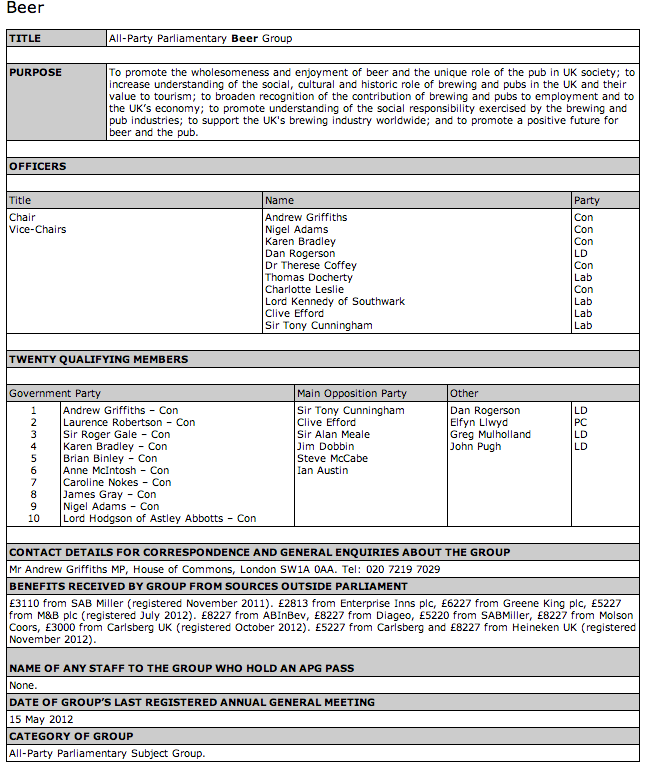
Right. Here’s the list of registered All Party Groups. Here’s an example of what’s recorded:

APG form

Conveniently, there’s a Scraperwiki scraper (David Jones / All Party Groups) grabbing this information, so I though I’d have a play with it.

Looking at the benefits, there is a fair bit of convention in the way benefits are described. For example, we see recurring things of the form:

  • 5000 from CAFOD, 6000 from Christian Aid – that is, [AMOUNT] from [ORGANISATION]
  • Age UK (a charity) acts as the groups secretariat. – that is, [ORGANISATION] {(OPTIONAL_TYPE)} acts as the groups secretariat.

We could parse these things out directly (on the to do list!) but as a short cut, I thought I’d try a couple of content analysis/entity extraction services to see if they could pull out the names of companies and charities from the benefits list. You can find the scraper I used to enhance David Jones’ APPG scraper here: APG Enhancer.

Here are a couple of sample reports from my scraper:

This gives a first pass attempt at extracting organisation (company and charity) names from the APPG register, and in passing provides a partial directory for looking up companies by APG (partial because the entity extractors aren’t perfect and don’t manage to identify every company, charity, association or other recognised group.

A more thorough way to look up particular companies is to do a site’n’path limited web search: eg
aviva site:http://www.publications.parliament.uk/pa/cm/cmallparty/register/

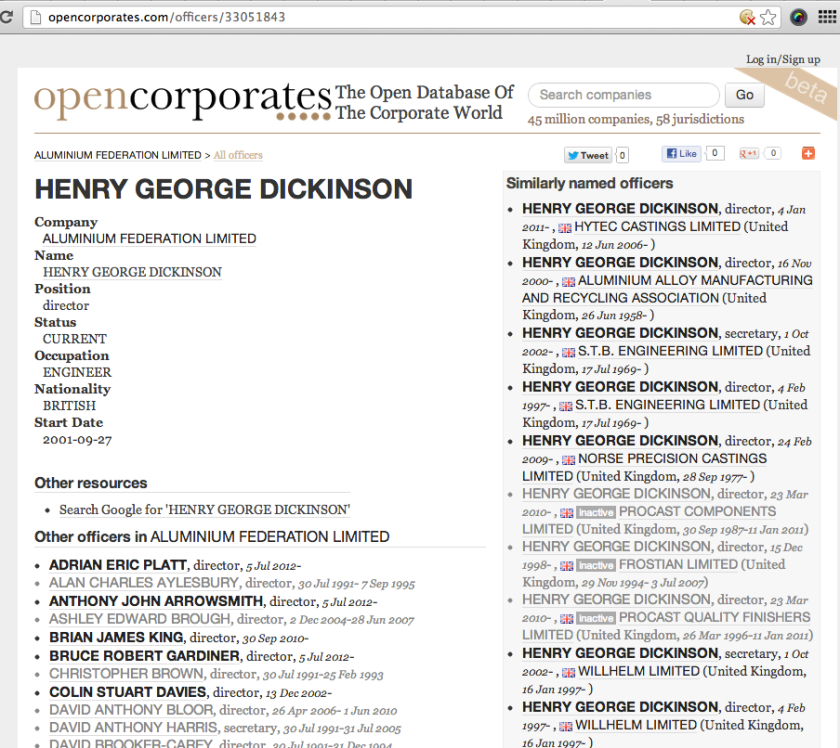
How might we go further, though? One way would be to look up companies on OpenCorporates, and pull down a list of directors:

opencorposrates - look up directors

And then we can start to walk through the database of directors, looking for other companies that appear to have the same director:

opencorporates - director lookup

(Note: we need to watch out for false positives, whereby one director has the same name as another person who is also a company director. There may be false negatives too, where we don’t find a directorship held by a specific person because a slightly different variation of their name was used on a registration document.)

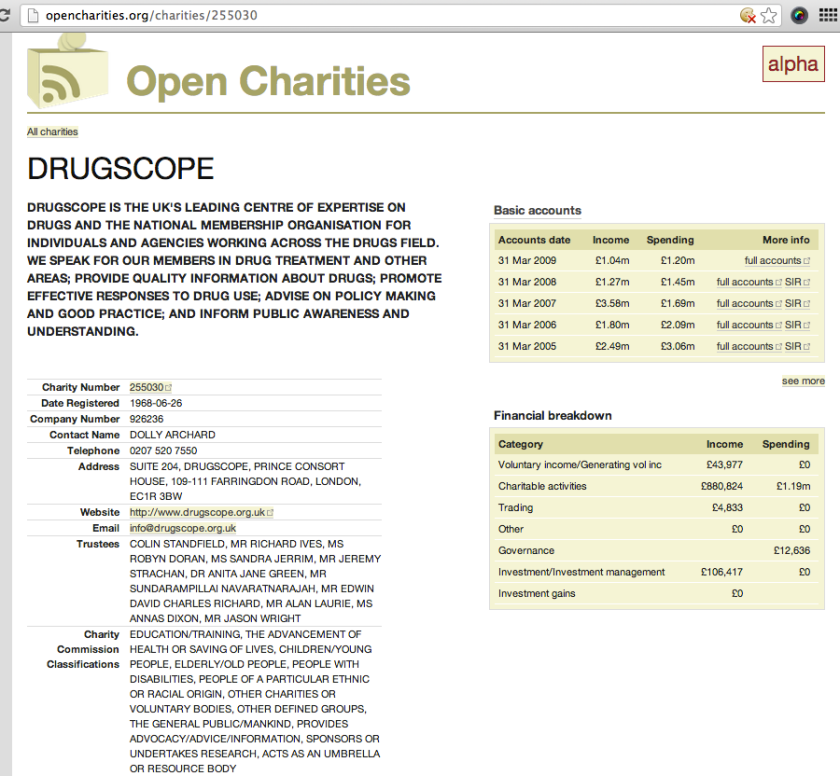
We can also look up charities on OpenCharities to find charity trustees:

OpenCharities charity lookup

If we’re graph walking, we might then look up the trustees on OpenCorporates to see whether or not the trustees are directors of any companies with possible interests in the area, and as a result identify companies who may be trying to influence Parliamentarians through APPGs that benefit from the direct support of a charity, via that charity.

In this way, we can start to build out a wider direct interest graph around a Parliamentary group. I’m not sure how useful or even how meaningful any of this actually is, but it’s increasingly possible, and once the scripted patterns are there, increasingly easy to deploy in other contexts (for example, wherever there is a list of company names, charity names, or names of people who may be directors. I guess a trustee search on OpenCharities may also be available at some point? From a graph linking point of view, I also wonder if any charities share registered addresses with companies, etc…)

PS by the by, here’s a guest post I just wrote on the OpenCorporates blog: Data Sketching With the OpenCorporates API.